Samsung has been building a business, run by Samsung Ads, to develop and exploit the huge installed base of Samsung SmartTVs and the firm has published, through DTV Europe, an interesting analysis of how viewing habits have changed during the pandemic.

It can be downloaded here (registration needed)
Now, you might think that the data (which covers the US, Canada and ‘EU5’ of Germany, UK, France, Italy and Spain) would apply only to a particular type of viewer, the type that buys Samsung TVs, but the report starts by claiming that “the Samsung TV user universe is broadly representative of all TV users for each country”. That view is based on data from market researcher, Kantar ComTech in Q1 2021.
The data that is analysed came from Samsung’s ACR (Automatic Content Recognition) technology which knows if the viewer is watching streamed or broadcast content. It also focuses on what has happened in 2020 and 2021 as the world has responded to the pandemic.
The firm found, unsurprisingly that the level of TV watching from all sources correlated with the severity of lockdown restrictions. However, most of the growth came in streaming rather than linear TV. March 2020 saw streaming go past linear TV as a source and there was a huge growth to more than double the watching hours in the end of 2020 and early 2021, compared to early 2020. Streaming went past linear in March 2020 and stayed at over half of all viewing by the summer of 2021 although the Euros 2020 football tournament tilted things in favour of linear in Europe in June 2021.
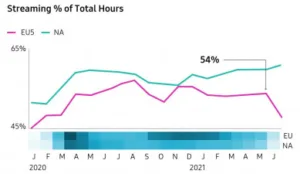
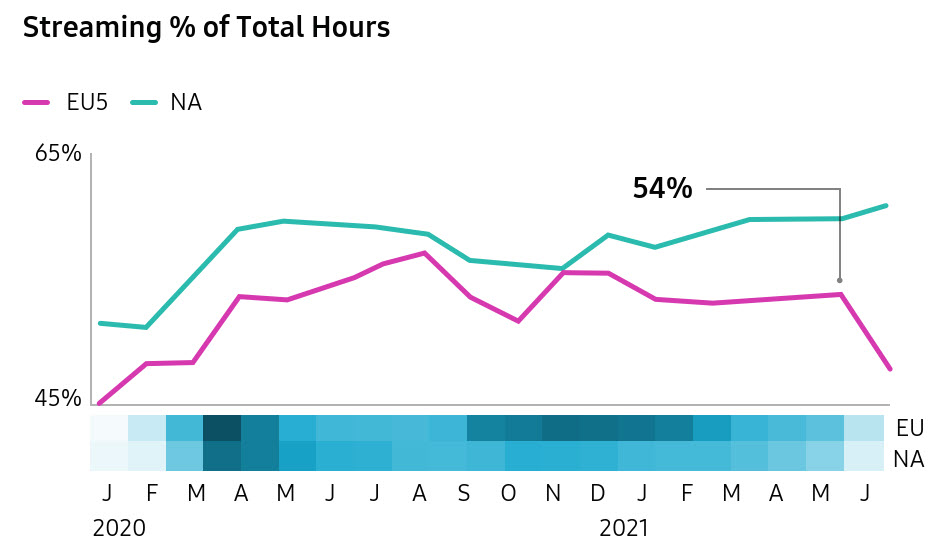 Streaming in EU5 overtook linear for the ?rst time in March 2020 and still retained 54% of viewing time by the end of May 2021. In June however, major sports events such as the Euro Football Cup drove up linear viewing, causing the streaming percentage to drop temporarily.
The report analyses the different viewing patterns in different EU5 countries and finds that the UK is lowest in the consumption of linear TV, while Germany is the biggest. On the other hand, Italians watched 1hour 52 minutes of linear TV per day. However, even in that region streaming increased 43% between January 2020 and June 2021.
Looking at linear viewing, the report divided watchers into ‘light, medium and heavy’ watchers. In North America (NA), it is the light viewers that have been switching to streaming fastest, while the heavy viewing group have been hanging on to their habits. The NA linear share is decreasing faster than the EU5 which is more balanced in its development. The conclusion is that linear viewing is very concentrated on heavy viewers.
Advertising-funded VOD is Growing
It’s no real surprise that video-on-demand funded by advertising (AVOD) is growing – that trend has been widely reported, but Samsung said that AVOD reached parity with subscription VOD (SVOD) in Q2 2020, getting to 72% vs 71% whereas a year before SVOD was ahead at 72% to 69% for AVOD. In the EU5 there was no significant change over that period with SVOD moving from 72% to 74% while AVOD stayed at 64% and Broadcaster Video on Demand (BVOD – new term to me – or catch-up services) stayed at 20%. While the percentages stayed the same, there was growth in the time spent on streaming in the EU5 with AVOD up by 130% from 23 minutes/day to 50, and SVOD up 46% to 1 hour 7 minutes.
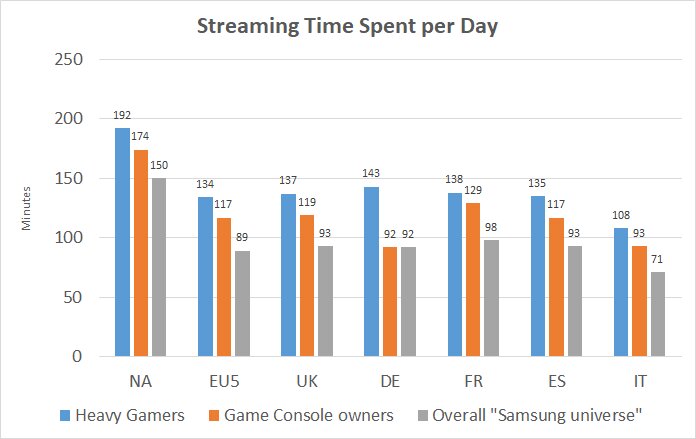
Finally, the report looks at the use of TVs for gaming and the intersection between streaming and game playing. Heavy gamers and game console users are much bigger streamers than the general viewer. That means, Samsung said, that strategies can be optimised to target them – and that could be useful information as gamers, the report said, are considered to be ‘hard to reach’.
 Data:Samsung Ads. Image:Meko Ltd
In my past business life, I have sometimes commissioned market research surveys. I always saw the main result that I expected to see and this data looks like that kind of result. Everybody knows that AVOD and streaming in general are growing, don’t they? However, the research I commissioned, and the reason that I repeated the process, was that as a manager, having the data gave me the confidence to really ‘go for it’ with policies designed to exploit the understanding. Without the confirming data from the research it would have been much harder to fully commit to the strategies needed. (BR)