Display Supply Chain Consultants (DSCC) is pleased to announce that it has developed a breakthrough report on the display equipment market that raises the bar on insights and coverage and is sure to become an industry standard.
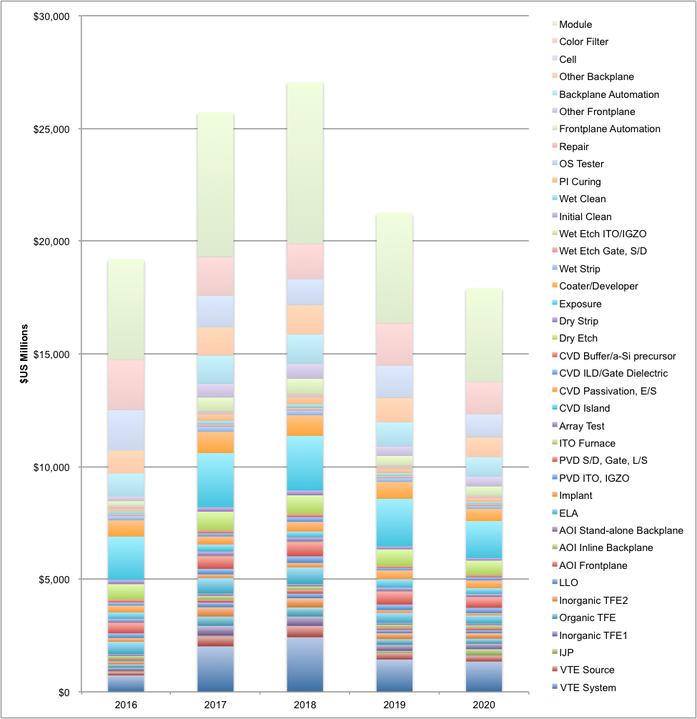
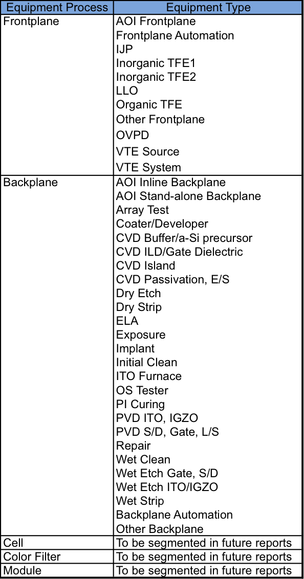
DSCC’s Quarterly Display Capex and Equipment Service now includes a database/pivot table/report that reveals equipment spending by tool type for every phase of every fab investment between 2016 and 2022. In addition to revealing number of tools ordered, ASPs and revenues, it reveals design wins and market share by individual fab investment by quarter for most of the major tool segments. The different tool segments covered are shown in Figure 1 and are nearly 2X greater than coverage offered by its competitors. The equipment market data is available on a bookings or billings basis.
According to DSCC Founder and CEO Ross Young, “We believe we have raised the bar on quality, quantity and value of intelligence on the display equipment market and display equipment companies through this service. This service is ideal for supply-side and buy-side analysts evaluating display equipment stocks and the overall display equipment market. It also allows display equipment suppliers to track their share in markets they participate in as well as track the market share, size and growth of segments they don’t currently participate in. In addition, it allows fab procurement personnel to track which tools their competitors are using, and the market share of the companies whose tools they buy by segment. Other deliverables in this service allow fab personnel to track the financial health and performance of equipment suppliers and for equipment suppliers to track the financial health of panel suppliers.
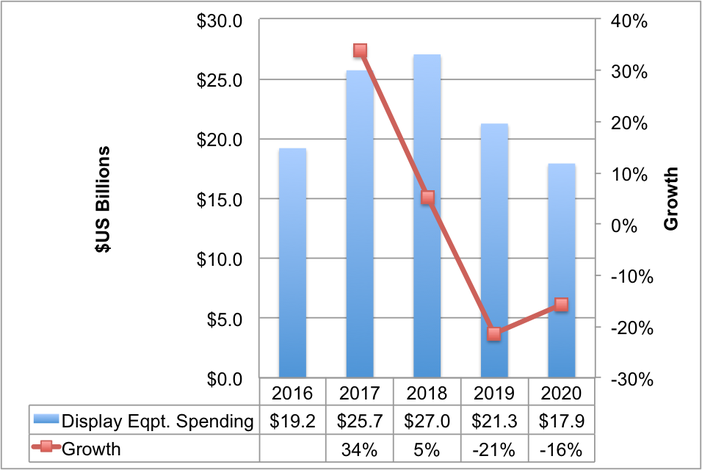
The first issue of this new service also shows that the display equipment market is much bigger than what other reports project. DSCC’s Display Capex and Equipment Service shows that the display equipment market is currently predicted to rise 34% in 2017 to $25.7B and rise another 5% in 2018 to $27B as shown in Figure 2. A key difference vs. competing reports is more accurate coverage of module spending which is significantly higher in flexible OLED fabs than in a-Si LCD TV fabs due to the amount of cutting, handling and flexible assembly required.
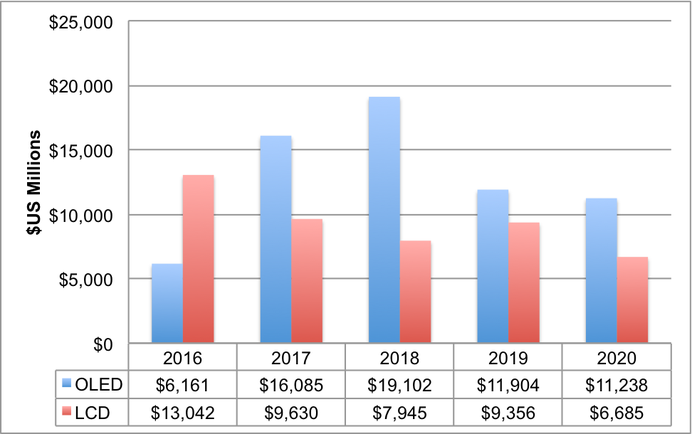
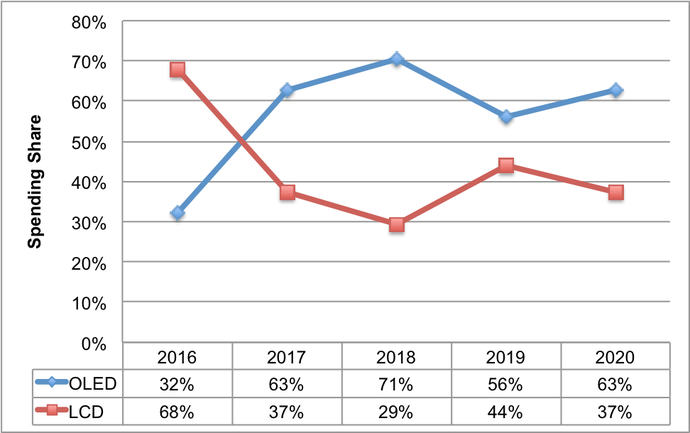
This report also allows users to segment fabs by frontplane or backplane type. As shown in Figures 4 and 5, OLED fabs are expected to lead equipment spending from 2017. From 2016 – 2020, OLED equipment spending is expected to account for a 58% of equipment spending, overtaking LCD spending with a 63% to 37% margin in 2017. This speaks to the capital intensity of OLED fabs with flexible OLED fab spending more than 2.5X greater than a-Si LCD fab spending at the same glass size.
This service also includes company capex data. Through Q3’17, publicly traded companies have disclosed capex of $24B. But this excludes suppliers who don’t disclose this data including CEC, CSOT, EDO, HKC, Royole, Truly and Visionox. Their capex data can easily be estimated based on DSCC’s fab by fab equipment expenditures resulting in an estimated $37B in 2017 display capex. This means DSCC’s equipment spending is 69% of total industry capex which panel manufacturers have indicated is a very fair assessment.
In addition to sizing all display equipment market segments and establishing market share by quarter and year on both a bookings and billings basis, DSCC’s Display Capex and Equipment Service also analyzes the earnings results of all panel and equipment suppliers each quarter, provides an equipment design win database covering announced POs and equipment awards and provides a weekly newsletter on the display equipment market. For more information on the Display Capex and Equipment Service and our LCD+OLED equipment spending data, please contact
[email protected] or (832) 451-4909.