
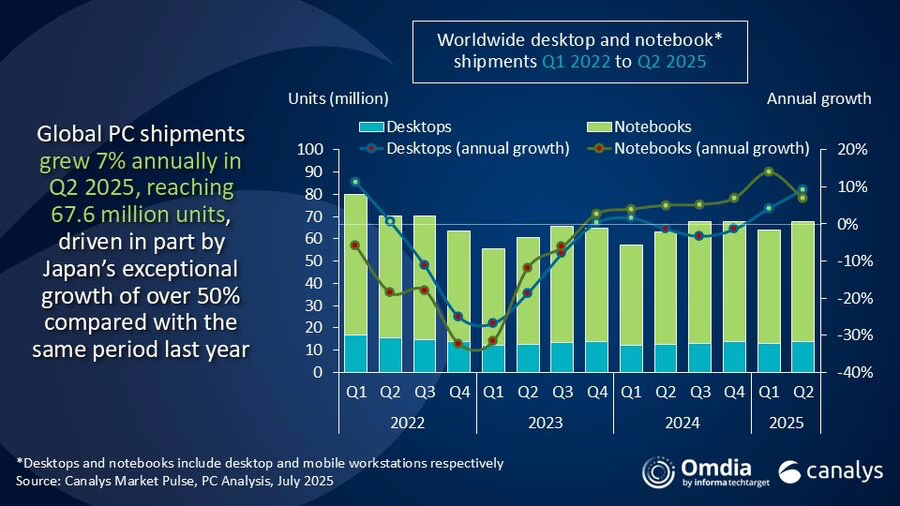
The global PC market posted solid growth in the second quarter of 2025, with shipments rising 7.4% YoY to reach 67.6 million units, according to new data from Canalys, now part of Omdia. The surge was primarily fueled by businesses scrambling to upgrade their systems ahead of Windows 10’s end-of-support deadline this October.
Notebook shipments, including mobile workstations, climbed 7% to 53.9 million units, while desktop shipments saw even stronger growth of 9% to reach 13.7 million units. The numbers paint a picture of a market divided between urgent commercial needs and cautious consumer spending.
“The Windows 10 end of support deadline this October is providing essential market stability, but is affecting consumer and commercial segments differently,” said Kieren Jessop, Research Manager at Canalys. The commercial refresh cycle is proving to be a lifeline for the industry, with businesses showing greater urgency in their upgrade decisions.
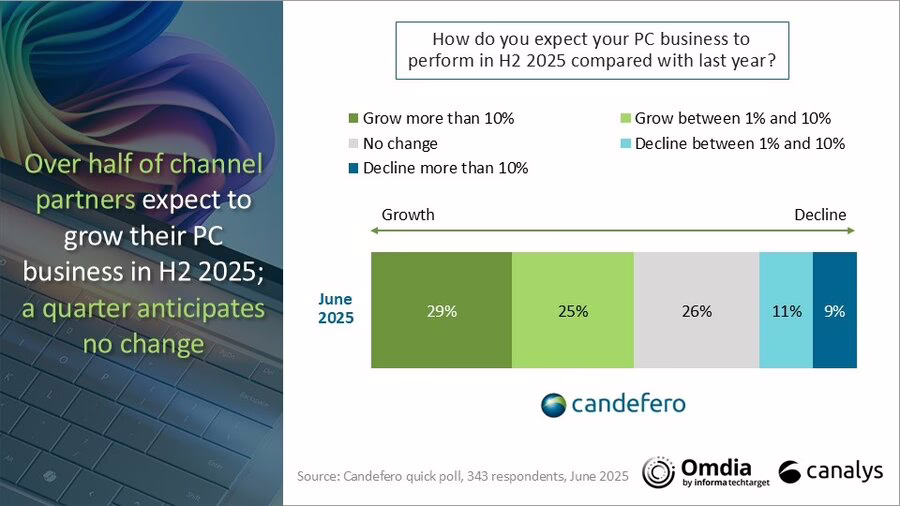
A June survey of channel partners revealed optimism in the sector, with over half expecting their PC business to grow year-over-year in the second half of 2025. Nearly 30% anticipate growth exceeding 10%, underscoring the momentum building from corporate deployments.
Lenovo maintained its position as the global PC market leader, shipping 17.0 million units in Q2 2025—a robust 15.2% increase from the previous year. The Chinese manufacturer now commands a 25.1% market share, up from 23.4% in Q2 2024.
HP held onto second place with 14.1 million units shipped, representing a modest 3.2% annual growth and a 20.9% market share. Dell, despite ranking third, faced headwinds with shipments declining 3.0% to 9.8 million units, causing its market share to slip from 16.0% to 14.5%.
The standout performer was Apple, which secured fourth place with an impressive 21.3% growth surge, reaching 6.4 million units and capturing a 9.4% market share. Asus rounded out the top five with equally strong 18.4% growth, shipping 5.0 million units.
Despite the positive shipment numbers, the industry faces significant headwinds from ongoing trade policy uncertainty. The Trump administration’s evolving approach to tariffs continues to reshape global supply chains and cast doubt over the market’s recovery trajectory.
“The Trump administration’s evolving tariff policies continue to reshape global PC supply chains while casting significant uncertainty over market recovery,” explained Ben Yeh, Principal Analyst at Canalys. “US imports of PCs have dramatically shifted away from China toward Vietnam as manufacturers seek to avoid potential tariffs.”
The complexity has intensified with the recent US-Vietnam trade deal, which establishes a 20% tariff on Vietnamese goods and a 40% tariff on transshipped items. While PCs currently remain exempt from tariffs regardless of origin, and Trump’s reciprocal tariffs have been delayed to August 1st, the underlying uncertainty persists.
“What began as straightforward China avoidance has evolved into a complex regulatory maze,” Yeh noted. The key concern is whether PCs manufactured in Vietnam using Chinese components or through Chinese-controlled operations will be classified as transshipments and face the punitive 40% tariff.
While businesses are driving current growth, consumer demand remains weak as customers globally grapple with macroeconomic uncertainty. Consumers are delaying purchases, pushing potential sales into 2026.
However, analysts see this as a temporary delay rather than lost demand. “As those consumer purchases are pushed into 2026, we anticipate the consumer PC market to grow next year as it coincides with a potential refresh cycle of COVID-era devices, which are starting to reach their end of life,” Jessop explained.
The market dynamics suggest that while Q2 2025’s growth was impressive, the real test will come in the months ahead as businesses complete their Windows 10 transitions and consumers decide whether to return to the market amid ongoing economic headwinds.
| Vendor | Q2 2025 Shipments | Q2 2025 Market Share | Q2 2024 Shipments | Q2 2024 Market Share | Annual Growth |
|---|---|---|---|---|---|
| Lenovo | 16,974 | 25.1% | 14,732 | 23.4% | 15.2% |
| HP | 14,124 | 20.9% | 13,683 | 21.7% | 3.2% |
| Dell | 9,772 | 14.5% | 10,078 | 16.0% | -3.0% |
| Apple | 6,361 | 9.4% | 5,246 | 8.3% | 21.3% |
| Asus | 5,058 | 7.5% | 4,271 | 6.8% | 18.4% |
| Others | 15,291 | 22.6% | 14,914 | 23.7% | 2.5% |
| Total | 67,579 | 100.0% | 62,923 | 100.0% | 7.4% |