
“When will elasticity kick-in”? That question posed by an investment banker before taking LG Display public in 2004 seems pertinent today, a dozen years later.
![]()
My answer then was that elasticity will kick-out, not in, because the tide of replacement demand in the PC market was ebbing away. Perhaps that deserves more explanation because people are not always precise in their use of the term. Most of the time, we can assume that elasticity means demand elasticity relative to price. The notion of elastic response pertains to a change in sales revenue in response to a change in price. Sales revenue is a result of the quantity of product sold times its average price, so sales will rise only if quantity rises more than price falls. In simple terms, a 1% increase in demand resulting from a 2% decrease of price will not increase sales revenue. For price discounts to drive sales up, the demand response must be greater. In other terms, elasticity is the constant of integration on the demand function (and if anyone wants to explore that further, send me an e-mail).
For such math-magical reasons, we see elasticity as the slope of a straight trend line on a Log-Log chart (or a ln-ln chart for us fashion-forward people who use only natural logarithms). If the slope is steeper than -1, then quantity times price increases as price decreases. That is what people usually mean by saying a market is elastic (and us fashion-forward people use the Greek character eta “?” for the constant of integration). Of course, buyers might not respond to price as much as producer hope; a slope less negative (more horizontal) than -1 means revenue will decrease.
Let’s look at something you haven’t seen before. I hope it provokes some new thoughts…
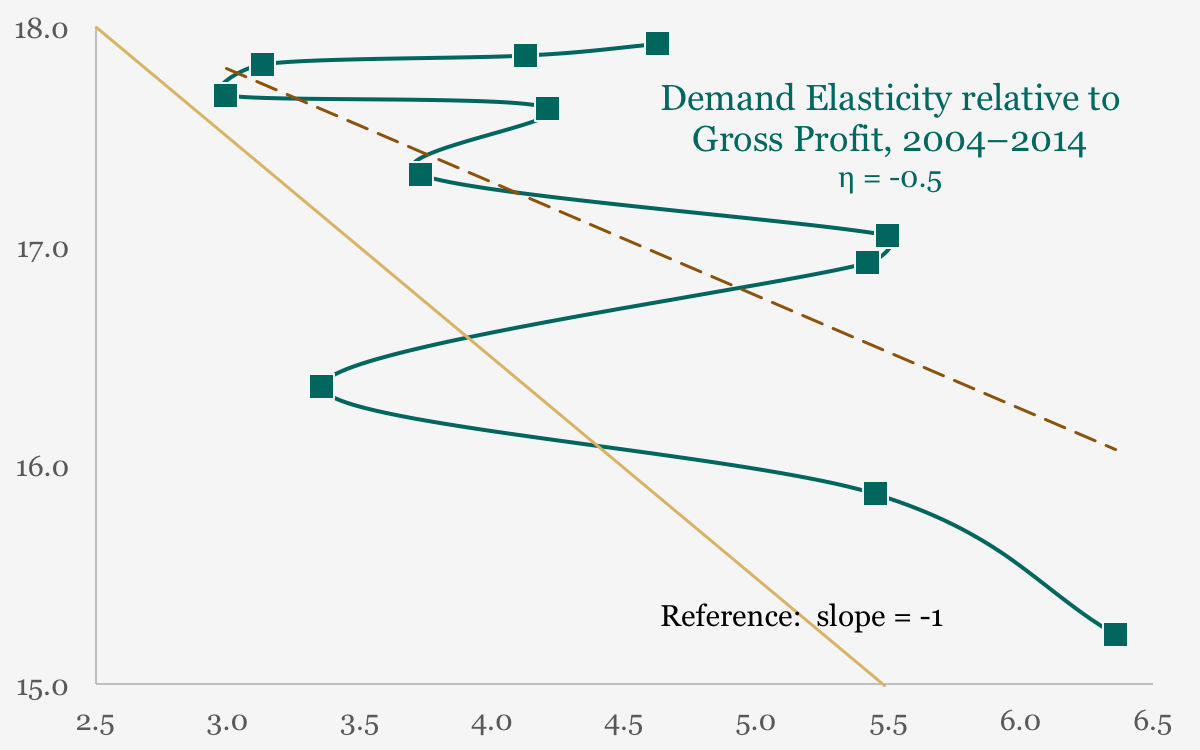
Yes, it is possible to plot the demand response to gross profit. The chart above uses the log of square meters shipped annually by AU Optronics (AUO) and LG Display (LGD) from 2004 through 2014. We see a serpentine green curve as areal gross profit rises and falls with product mix and customer mix. The brown, dashed trend line shows an inelastic slope of -1/2 (-0.5). This implies that leading producers cannot increase profit revenue (quantity times unit profit) by decreasing price minus cost. That makes sense because producers cannot increase profit by cutting price below cost. The good news is that buyers appear willing to take more profitable products some of the time. Note that there are swings above the trend line when producers increase profit the old-fashioned way: raising prices or cutting costs. I call such positive-slope swings fantastic markets, not just elastic ones!
Now we can look at conventional elasticity with new eyes…
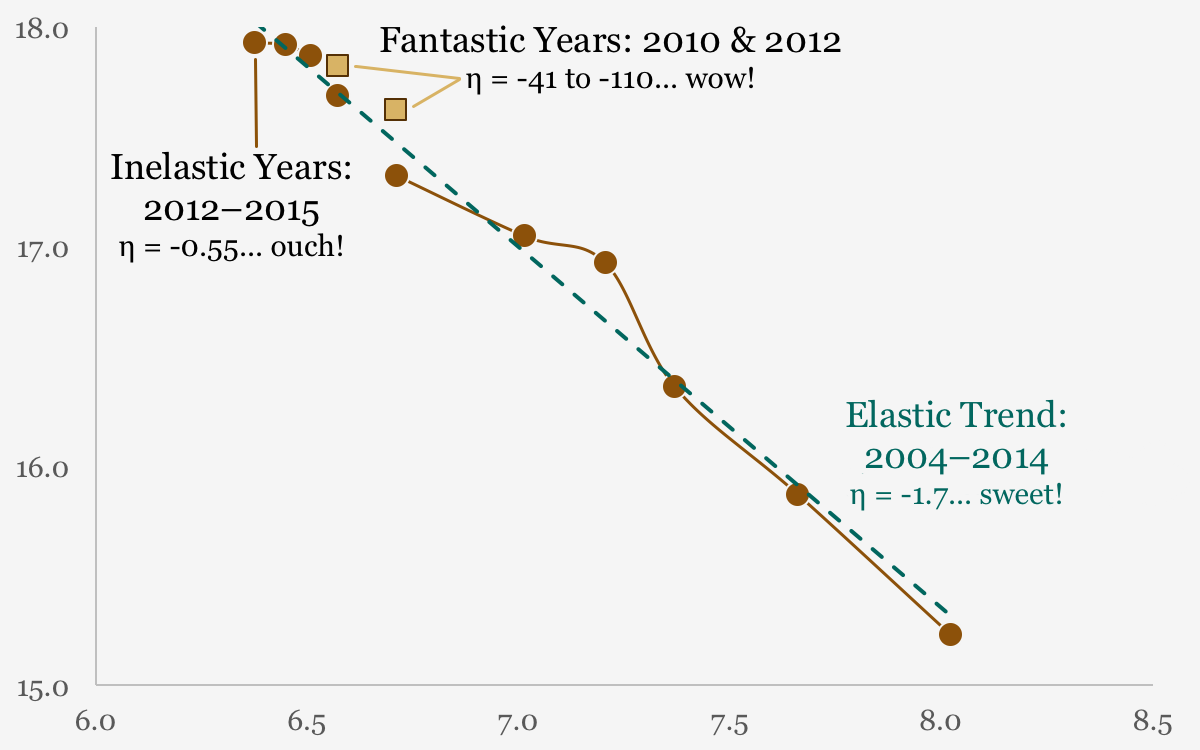
The Demand-Price chart uses combined data from AUO and LGD again. The y-axis is ln(area) as before but the x-axis represents the log of area price. From 2004 through 2014, elasticity was -1.7 …sales increased when price decreased. Note there were some fantastic years, however. The year-on-year changes in 2010 and 2012 were nearly vertical with large increases in demand for little changes in price. In contrast, the recent slope of about -0.5 for 2012 through this year (scaled as 2*1H’15) implies that a 50% decrease in price would increase demand only 41%. Sales revenue would decrease 28% as a result.
It may pay to keep such things in mind as we move toward $150 FHD smartphones next year. Can panel makers price profitably and meet potential demand in India? Can demand for UHD TV increase fast enough to offset aggressive pricing? Sometimes elasticity can kick you in the rear. – David Barnes