In case you missed it, here in the US, headlines continue the cry for pay TV’s demise. In September 2017 Variety shouts: “Cord-Cutting Explodes: 22 Million U.S. Adults Will Have Canceled Cable, Satellite TV by End of 2017”; and in January the NY Post (via AP) “Cable TV prices keep going up as more people cut the cord”.
![]()
The industry continues to be squeezed by rising carriage costs and intense competition from over the top (OTT) broadband and the rise in virtual service providers like Sling, DirectTV Now and PhiloTV.
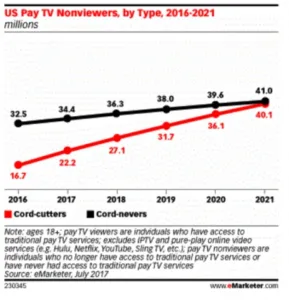
By the numbers, Variety reports the eMarketer.com study stating “…in 2017, a total of 22.2 million U.S. adults will have cut the cord on cable, satellite or telco TV service to date — up 33% from 16.7 million in 2016.” (And this data is up from predictions by the groups prior estimate of 15.4M cord-cutters as of the end of 2017.) Add to this, the number of those consumers (cord nevers) is up to 5.8% this year, at plus 34M (see chart below).
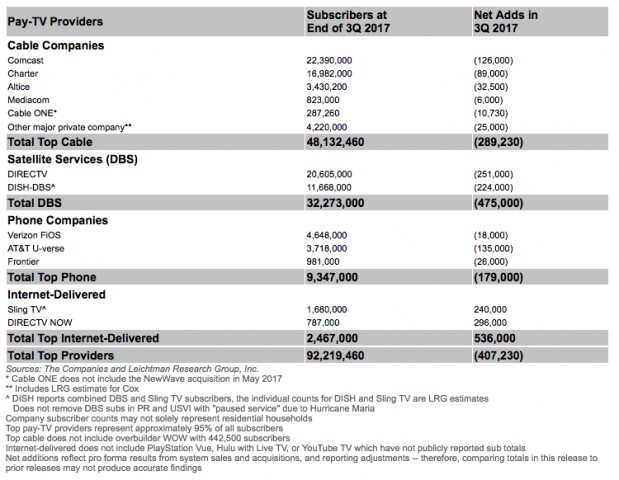
Juxtaposition these latest pay tv price hikes and subscriber churn with the year end 2017 study by Leichtman Research (LRG), which shows a whopping 84% of all US households now get internet service at home with almost total coverage (98%) of that group accessing the web via broadband, and the picture is clear; we are headed for an OTT (over the top) TV streaming future here in the USA. The group reported end of Q3 2017 numbers showing just how far south Net Adds have declined stating, ” The largest pay-TV providers in the US — representing about 95% of the market — lost about 405,000 net video subscribers in 3Q 2017, compared to a loss of about 250,000 subscribers in 3Q 2016,” the company reported.
Here’s the recent subscriber breakdown numbers from the research group: the top six cable companies 48.1M, satellite 32.3M subscribers, Telco’s (AT&T, Verizon, Frontier) 9.3M subscribers. That’s 92.2 M subscribers (subs) in all.
On the flip side, the Durham, NH based research group LRG reports, “… broadband Internet service — increase from 76% in 2012, and 53% in 2007, with other related findings including:
- 16% of households only get Internet service at home — compared to 41% in 2012
- 42% not online at home access the Internet on a smartphone — representing 7% overall
- 91% of all households access the Internet either at home and/or on a smartphone — compared to 85% in 2012
- 91% with annual household Incomes >$50,000 get broadband at home — compared to 72% with annual household incomes <$50,000
- 85% of households use at least one laptop or desktop computer — 93% of this group get an Internet service at home
- 63% of those not online at home do not use a laptop or desktop at home
So now the facts pretty much speak for themselves, as the long time payTV model that provides hundreds of unwanted channels bundled with heavy tiered pricing finally gives way to á la carte viewing on the watch anytime schedule subscribers demand. – Stephen Sechrist
Note: The LRG study, Broadband Internet in the U.S. 2017 is based on a telephone survey of 1,203 adults age 18+ from throughout the continental U.S. The random sample of respondents was distributed and weighted to best reflect the demographic and geographic make-up of the U.S. The telephone survey (including landline and cell phone calls) was conducted in October-November 2017. The overall sample has a statistical margin of error of +/- 2.8%.
Dataxis: 7.4m Linear OTT Pay TV Subscribers in Europe as of 2017 Q37.4 Million
Linear OTT Pay TV Subscribers In Europe At End-3Q 2017
MENA Pay-TV Revenues To Reach $3.62bn
Digital TV Research: Pay TV Competition Biting in MENA
Digital TV Research: Pay TV Subscribers in Africa to Grow
Dataxis: Pay TV Reaches 6.7 Million Subscribers in South East Asia