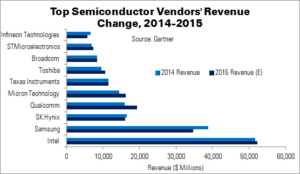
Semiconductor revenue totaled $333.7 billion in 2015, a 1.9% YoY decrease from $340.3 billion a year earlier. The top 25 vendors’ combined revenue rose 0.2% and accounted for 73.2% of total market revenue.
The semiconductor market was affected by weakened demand for key electronic equipment; the continued impact of the strong dollar; and elevated inventory. Unlike 2014, when revenue grew in all categories, 2015 saw mixed performance. Optoelectronics, non-optical sensors, analogue and ASICs all registered growth, while other segments declined. ASIC growth was highest at 2.4%, due to demand from Apple.
Intel’s revenue fell 1.2%, due to lower PC shipments. However, the company remained the market leader for the 24th year in a row, with a 15.5% share. Samsung, thanks to its memory business driving growth of 11.8%, maintained its second place spot with an 11.6% share. Qualcomm went past SK Hynix to get into third place.
Sergis Mushell of Gartner said, “The rise of the US dollar against a number of different currencies significantly impacted the total semiconductor market in 2015… End equipment demand was weakened in regions where the local currency depreciated against the dollar. For example in the eurozone, the sales prices of mobile phones or PCs increased in local currency, as many of the components are priced in U.S. dollars. This resulted in buyers either delaying purchases or buying cheaper substitute products, resulting in lower semiconductor sales. Additionally, Gartner’s semiconductor revenue statistics are based on U.S. dollars; thus, sharp depreciation of the Japanese yen shrinks the revenue and the market share of the Japanese semiconductor vendors when measured in U.S. dollars”
| Top 10 Semiconductor Vendors by Revenue, Worldwide, 2015 (Millions of Dollars) | ||||
|---|---|---|---|---|
| Vendor | 2015 Revenue (E) | 2014 Revenue | 2015 Share | YoY Revenue Change |
| Intel | 52,331 | 51,709 | 15.5% | -1.2% |
| Samsung | 34,742 | 38,855 | 11.6% | 11.8% |
| SK Hynix | 15,997 | 16,494 | 4.9% | 3.1% |
| Qualcomm | 19,291 | 15,936 | 4.8% | -17.4% |
| Micron Technology | 16,278 | 14,448 | 4.3% | -11.2% |
| Texas Instruments | 11,538 | 11,533 | 3.5% | 0.0% |
| Toshiba | 10,665 | 9,622 | 2.9% | -9.8% |
| Broadcom | 8,428 | 8,419 | 2.5% | -0.1% |
| STMicroelectronics | 7,376 | 6,890 | 2.1% | -6.6% |
| Infineon Technologies | 5,693 | 6,630 | 2.0% | 1650.0% |
| Others | 157,992 | 153,182 | 45.9% | -3.0% |
| Total | 340,331 | 333,718 | 100.0% | -1.9% |
| Source: Gartner | ||||

