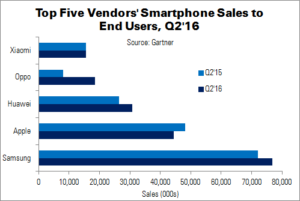
Although smartphone sales are slowing, they still grew 4.3% YoY in Q2’16, to 344 million units, says Gartner in its recent report on the mobile phone market. Total mobile phone sales, including featurephones, were down 0.5%, with five of the top five vendors – four of them Chinese – showing growth: Samsung, Huawei, Oppo, Xiaomi and BBK Communication Equipment.
Demand for premium smartphones was down in Q2, as consumers waited hardware refreshes in Q3. Declining feature phone sales (-14%) also held the mobile phone market back. All mature markets (except Japan) experienced a slowdown in smartphone demand, leading to sales falling 4.9%. Emerging regions (except LATAM), though, saw growth of 9.9%.
| Worldwide Smartphone Sales to End Users by Vendor in Q2’16 (000s) | ||||
|---|---|---|---|---|
| Vendor | Q2’16 | Q2’15 | Q2’16 Share | Q2’15 Share |
| Samsung | 76,743.5 | 72,072.5 | 22.3% | 21.8% |
| Apple | 44,395.0 | 48,085.5 | 12.9% | 14.6% |
| Huawei | 30,670.7 | 26,454.4 | 8.9% | 8.0% |
| Oppo | 18,489.6 | 8,073.8 | 5.4% | 2.4% |
| Xiaomi | 15,530.7 | 15,464.5 | 4.5% | 4.7% |
| Others | 158,530.3 | 160,162.1 | 46.0% | 48.5% |
| Total | 344,359.7 | 330,312.8 | 100.0% | 100.0% |
| Source: Gartner | ||||
Market leader Samsung had nearly 10% more share than its closest competitor, Apple. Galaxy A and J series phones competed well with low-cost Chinese brands, and new releases helped the company to win back share that it had lost in emerging markets.
Apple saw its share decline 7.7% after three quarters of slowing demand. Sales declined in the firm’s biggest market, North America, as well as Western Europe. The largest decline was felt in Greater China and mature APAC markets, where sales fell 26%. Apple performed best in Eurasia, Sub-Saharan Africa and Eastern Europe, where sales were up more than 95%.
Oppo, with its popular R9 handset, experienced the highest sales increase of any company in the top five: 129%.
Android remained the OS market leader, regaining share from iOS to reach 86% of the smartphone market. Mid- to low-end devices continued to drive Android’s popularity, although premium phones also recorded a 6.5% increase.
| Worldwide Smartphone Sales to End Users by Operating System in Q2’16 (000s) | ||||
|---|---|---|---|---|
| OS | Q2’16 | Q2’15 | Q2’16 Share | Q2’15 Share |
| Android | 296,912.8 | 271,647.0 | 86.2% | 82.2% |
| iOS | 44,395.0 | 48,085.5 | 12.9% | 14.6% |
| Windows | 1,971.0 | 8,198.2 | 0.6% | 2.5% |
| Blackberry | 400.4 | 1,153.2 | 0.1% | 0.3% |
| Others | 680.6 | 1,229.0 | 0.2% | 0.4% |
| Total | 344,359.8 | 330,312.9 | 100.0% | 100.0% |
| Source: Gartner |
Analyst Comment
The share of non-Android and iOS systems dropped below 1.0% in total this time. It’s hard to imagine, other than a direct subsidy from Microsoft, why anybody would bother developing apps for Windows or Blackberry devices. (BR)

