
The Strasbourg-based Observatory, part of the Council of Europe, has just launched this year’s Yearbook 2018/2019 on line service.
This database provides comparative European data on film, television, on-demand and physical video in 41 countries. The country by country comparative pan-European tables are downloadable in Excel form. Downloadable country profiles are also included.
Main insights of the Yearbook edition 2018/2019:
1. No evidence of cord-cutting in Europe for the moment
- Total number of households subscribing to pay-TV continues to increase
- IPTV share of pay-TV subscribers up to 25%
- Cable stagnating over the last five years, and satellite growth comes to a halt.
Subscribers to pay-TV in Europe – in thousand
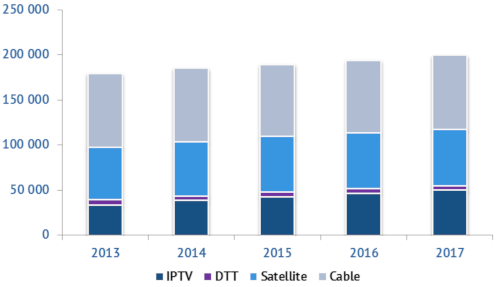
Source: European Audiovisual Observatory analysis of Ampere Analysis data
2. US groups account for 72% of the top 50 audiovisual groups revenues
- This is a massive leap, given that US groups’ share was only 66% in 2012
- The top 50 audiovisual groups cumulated revenues grew at an annual rate of 10%, much higher than the market, due to permanent consolidation
- Netflix ranks n°15 in the top 50
Cumulated revenues of the top 50 audiovisual groups by region of origin – in bn EUR
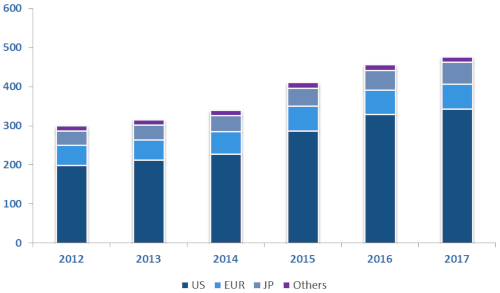
Source: European Audiovisual Observatory analysis of Ampere Analysis data
3. Television viewing is slowly decreasing – Romania tops the European viewing charts
- Daily viewing time ranges from 1h41mn in Iceland to 5h46mn in Romania
- On average, television viewing in Europe declined by 0.3% per year between 2012 and 2017.
- Sharpest decline in Iceland, Denmark, Latvia, Norway and the United Kingdom
Average daily television viewing per person in Europe – in hh:mm
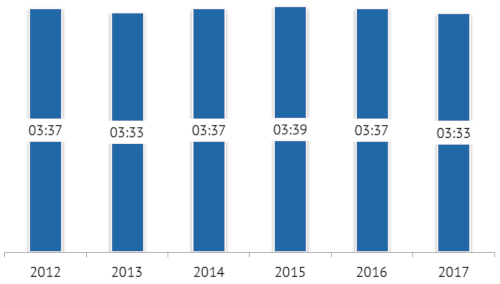
Source: European Audiovisual Observatory analysis of Eurodata TV data
4. Blu-ray joins DVD in fast decline
- On average, the physical video market declined by 14% per year between 2013 and 2017
- DVD (–16%) declined faster than Blu-ray (-7%)
- Rental accounts for 6% of the total market, vs. 11% in 2013
Physical video market in Europe – in bn EUR
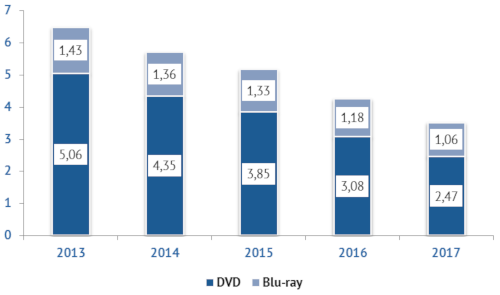
Source: European Audiovisual Observatory analysis of IHS data
5. SVOD accounts for 72% of pay-on demand revenues
- On average, pay on-demand services grew by 45% per year between 2013 and 2017
- The main was driver for growth was SVOD, with a 74% average annual growth rate
- In TVOD, retail is growing faster than rental and accounts now for 42% of TVOD revenues
Pay on-demand revenues in Europe – in bn EUR
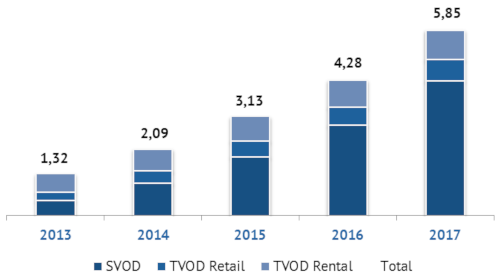
Source: European Audiovisual Observatory analysis of Ampere Analysis data
An executive “Key Trends” summary of the Yearbook is available free on line.