We the long-awaited earnings releases of CPT and CEC Panda this week, we now have almost all the financial results of panel makers for Q4 2018, and we have compiled a comparison view as part of DSCC’s Quarterly Display Supply Chain Financial Health Report.
The comparison highlights the dominant position of Samsung in terms of industry profits, as well as some of the challenges faced by the industry.
The first chart below shows the revenue totals of the twelve panel makers we track. This quarter we add CEC Panda to our analysis, publicly traded as Nanjing Huadong Electronics Information & Technology Co Ltd. This does not cover the Chengdu and Xianyang CEC companies. We are also tracking Visionox which started in Q2 2018, but they have not completed a Q4 or full-year 2018 financial report as of April 4, 2019.
Samsung revenue jumped by 71% Q/Q in Q4 and Samsung regained the lead in revenue, thanks to increased OLED panel shipments. Even with the big jump Q/Q, SDC revenues dropped 11% Y/Y from Q4 2017. Aside from Samsung, the rest of the industry recorded only 3% revenue growth Q/Q, and most of the companies showed sequential revenue declines.
Panel Maker Revenues, 4Q16 – 4Q18
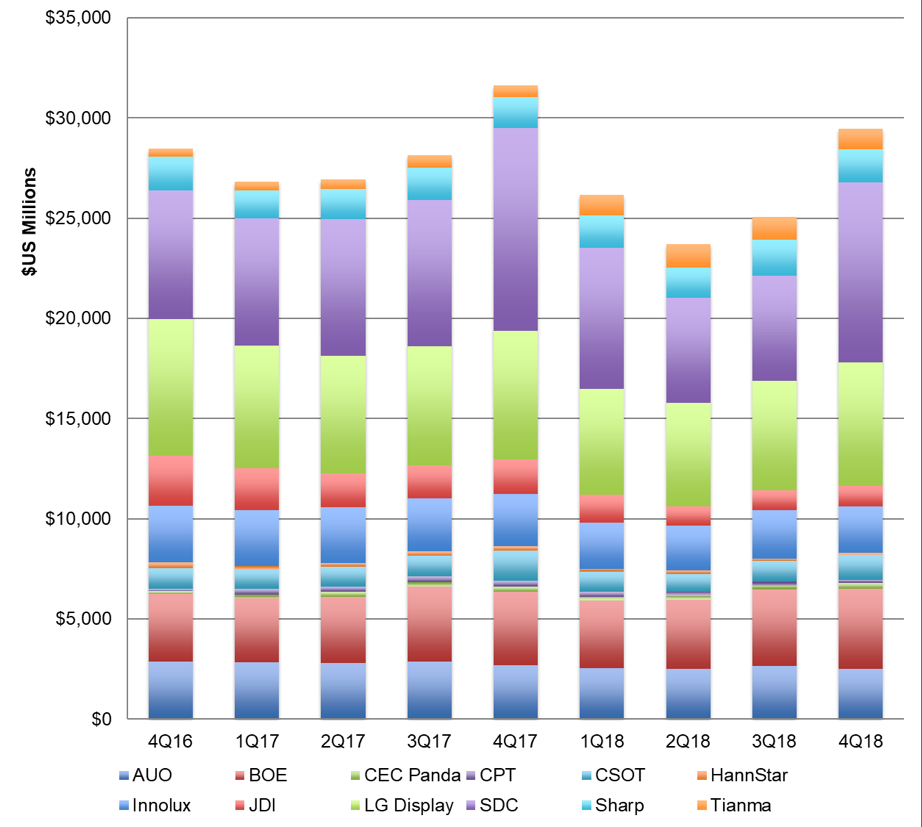
Source: DSCC Quarterly Display Supply Chain Financial Health Report
The disparity between Samsung and the rest of the industry is even more apparent looking at operating profit. Samsung Display’s operating profit of $860 million represented 62% of total industry profits of $1.4 billion, far ahead of 2nd place LGD at $247 million. Together the two Korean display makers captured 80% of the operating profits of the industry. Industry totals were dragged down by the severe $221 million operating loss of CPT, in what might be the last public financial report of that company as it undergoes bankruptcy proceedings.
Most companies fared worse in Q4 than in Q3, with only CEC Panda, LGD, and JDI reporting improvements in operating profit. CEC Panda benefited from a large government subsidy payment to register a profit for the first time in 2018. LGD benefited from a profitable OLED TV panel business to overcome the headwinds of falling LCD panel prices. JDI recorded a surge in shipments for the Apple iPhone XR (even if the surge was a bit less than hoped) to end six consecutive quarters of operating losses and record an operating profit in Q4.
Panel Maker Operating Profit, 4Q16 – 4Q18
Source: DSCC Quarterly Display Supply Chain Financial Health Report
On a margin basis, though, Samsung’s operating margin of 10% of sales was outpaced by Tianma at 13%, and also by CEC Panda at a subsidy-distorted 61%. Hannstar had a severe drop from +9% operating margin in Q3 to -39% in Q4, but they avoided being the worst performer in the industry, as that distinction fell to CPT with -164% operating margin.
As we noted last week in highlighting BOE’s quarterly results, BOE surpassed LGD to take the industry lead in area shipments in Q4 with 11.7 million square meters compared to LGD’s 11.1 million. LGD recorded a shipment area record of its own in Q4, but it was not enough to maintain the industry lead. Four of the top five panel makers report area shipments and prices (Samsung does not), and the industry for the second consecutive quarter set a record for reported area shipments in Q4, with a 10% increase Q/Q to more than 44 million square meters.
Area Shipments by Panel Makers, 4Q16 – 4Q18
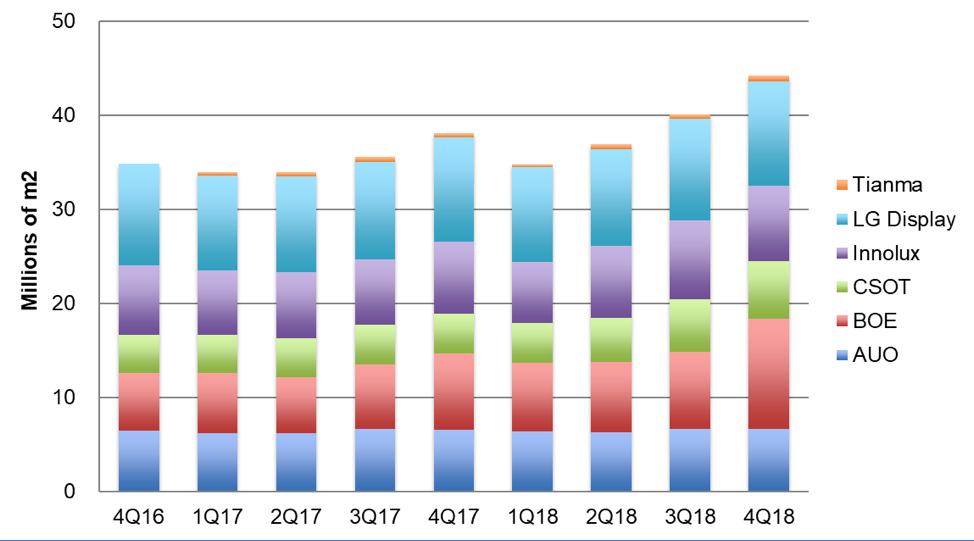
Source: DSCC Quarterly Display Supply Chain Financial Health Report
While we frequently think of LCD panels as commodities, and panel makers can switch between different products, the area prices reported by the panel makers show dramatic differences. Among the large players who report area prices, LGD captures far higher prices than its competitors, as shown in the chart, and LGD area ASPs increased sharply in Q4 as the company increased sales of OLED TV panels while their competitors AUO, Innolux, and BOE suffered the decline in LCD panel prices. In Q4, LGD got almost 2x the price per square meter of BOE and Innolux, and almost 3x as much as CSOT. Still, LGD’s area price of $559 fell far short of Tianma, not shown on the chart because it was so much higher at $1734. Tianma’s exclusive focus on smaller panels for smartphones and automotive displays allows them to command a dramatically higher average price than large-area panel makers.
Panel Maker ASP per Square Meter, 4Q16 to 4Q18
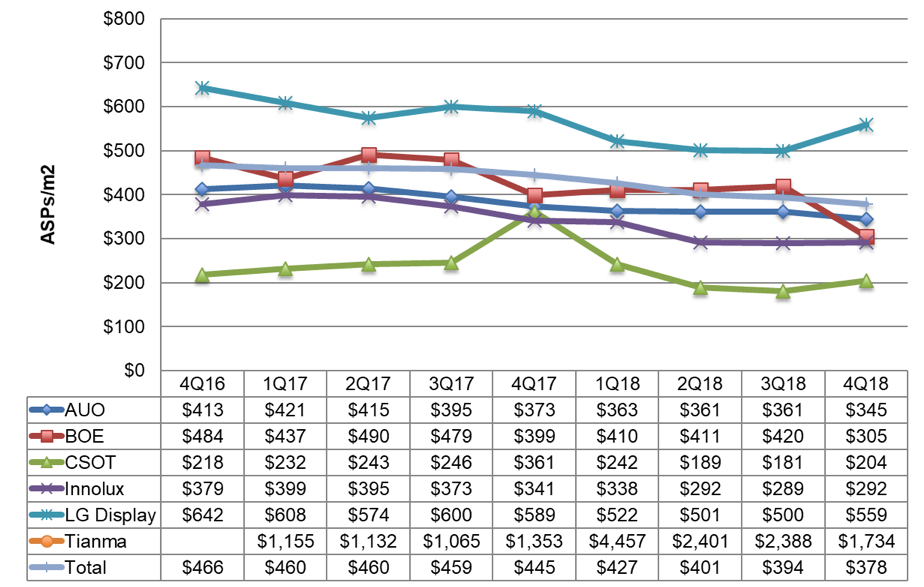
Source: DSCC Quarterly Display Supply Chain Financial Health Report
Product mix is a major driver of the differences in ASP. In particular, CSOT prices are especially low because their sales are primarily TV panels, which have the lowest area prices, and because CSOT sells LCD cells almost exclusively, rather than selling modules complete with the backlight unit. CSOT managed to record an increase in area ASP in Q4 as it increased shipments of smaller screen panels by 70% Q/Q, and while still a small part of CSOT’s revenue mix, the increased shipments raised the company’s area price.
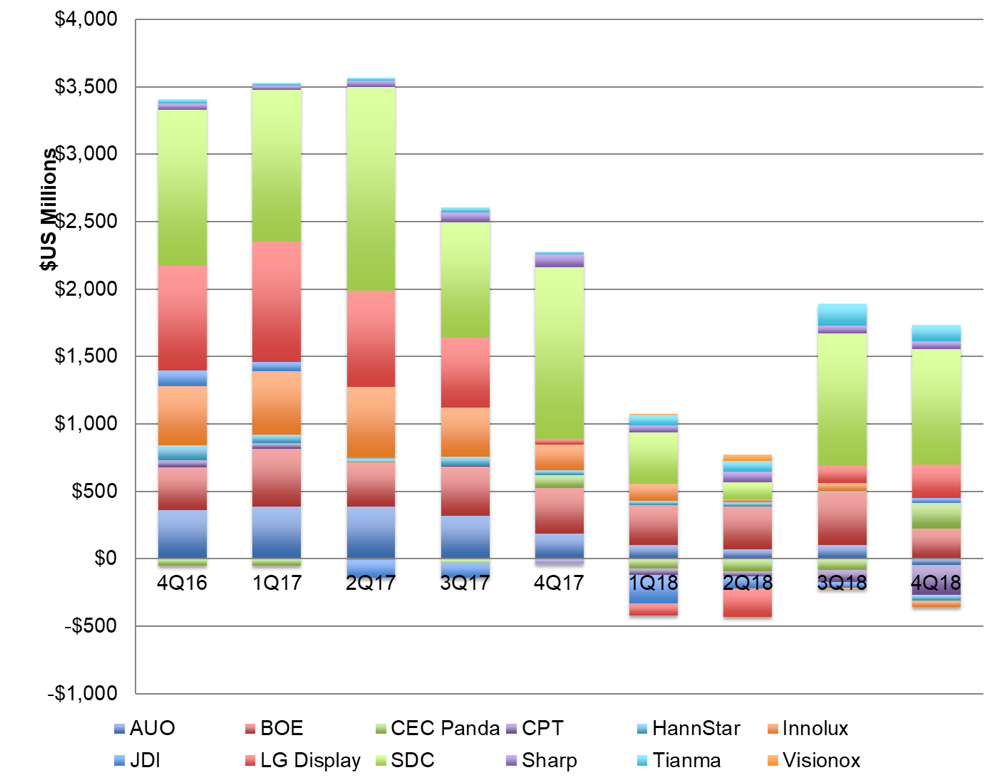
With net profits shrinking to break-even levels or worse for most of the players in the industry, and continuing investments for capacity by some major players, free cash flow has been negative for almost all the companies in the industry. An exception, not on the chart, would be Samsung. We don’t include Samsung Display in our free cash flow analysis because Samsung does not break out depreciation & amortization by division, but we can say confidently that with $860 million in operating profits, plus what is likely to be about $1 billion in depreciation per quarter, and only $443 million in capital expenditures for the quarter, Samsung Display is generating positive free cash flow.
Our chart included here shows FCF for other companies in the industry. AUO, despite recording almost negligible net income of $9 million in the quarter, sustained its pattern of positive free cash flow in Q4 with $144 million. Among all other panel makers, only CEC Panda, aided by subsidies, recorded positive free cash flow in the quarter. Both BOE and LGD recorded more than $1 billion in negative free cash flow for Q4, and those two companies combined had a massive $7.8 billion in negative FCF for the year.
Free Cash Flow for Panel Makers, 3Q16 to 3Q18
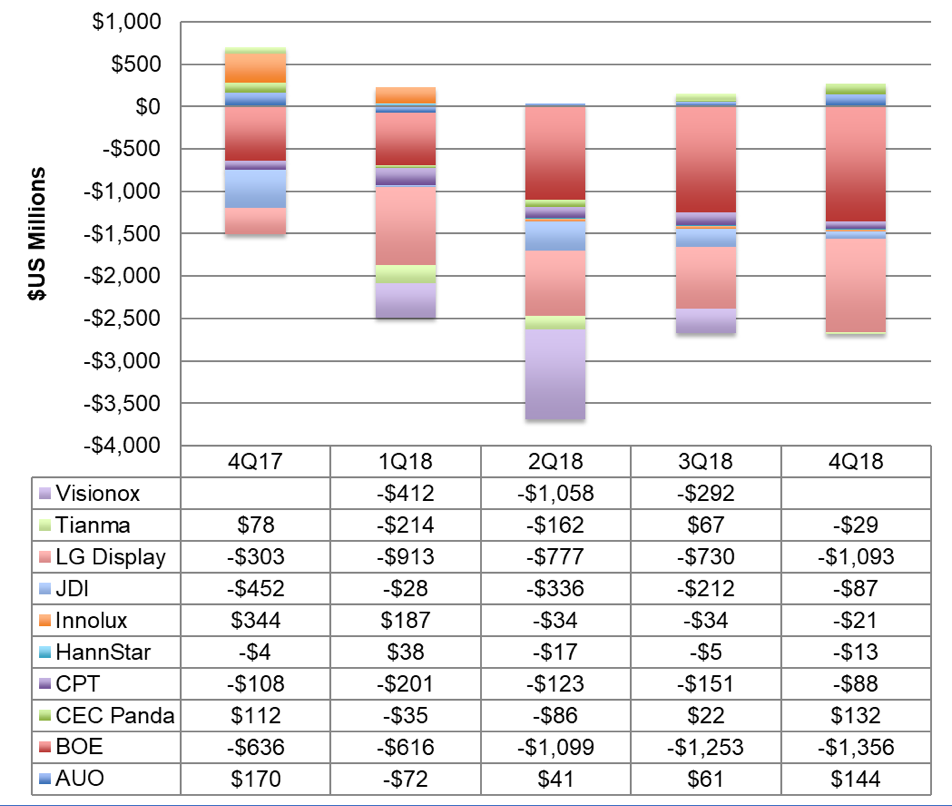
Source: DSCC Quarterly Display Supply Chain Financial Health Report
As the free cash flow picture highlights, this is a challenging time in the panel industry, and as noted above, this may be the last time this comparison includes CPT. With the stinging losses recorded in Q4, CPT has reached a negative stockholders’ equity value and will be de-listed from the Taiwan Stock Exchange. It is unclear if the company will continue to report its results to investors in any way.
Despite the difficulties, though, companies with clever strategies have managed to weather the current storm. AUO has been extremely disciplined in capex and continues to register positive free cash flow, and maintains a very stable 51% debt/equity ratio. Hannstar’s strategy of focusing on niche applications has kept that company at the top of the charts in operating margin until a sharp fall in Q4. Tianma’s approach of focusing on high value smartphone and automotive panels allows that company to sustain prices 3-6x that of its competitors. It’s a tough business, but clever companies are finding a way to succeed.