
Revenues from the sales of OLED display panels will increase 19% in 2019 to $31 billion, according to the latest update of DSCC’s Quarterly OLED Shipment and Fab Utilization Report.
OLED panel units in all applications will grow 22% to 610 million, and shipment area will grow 35% to exceed 9 million square meters.
?With the Q4 update, DSCC has updated its annual forecast for OLED panel shipments out to 2022, and we continue to expect dramatic growth in all of the major OLED applications, and the emergence of substantial quantities of shipments in today’s niche applications.
- OLED Panel Revenues will more than double from 2017 to 2022, increasing at a 16% CAGR to $48.9 billion
- OLED Area shipments will grow at a 36% CAGR from 2017 to 2022 as TV becomes an increasing part of the OLED mix, from less than 5 million square meters to 23.1 million square meters.
- OLED unit shipments will exceed 1 billion in 2022, growing at 18% from 2017 to 2022. While TV will remain a tiny portion of OLED units, OLED TV will grow at a 50% CAGR between 2017 and 2022, from 1.7 million to 13.1 million.
- Smartphone units will grow from 404 million to 899 million units, a 17% CAGR
- Among applications other than smartphones and TVs, OLED panel shipments in units will grow at a 20% CAGR, from 43 million units to 108 million. Smart Watch will remain the second largest application in terms of units
One of the most dramatic developments in the OLED panel shipments during the past two years is the increase in smartphone screen size. As shown in the chart, in 2017 more than 80% of OLED smartphone panels sold were less than 6”, but by next year this will flip, and more than 80% will be greater than 6”. We expect that the “sweet spot” of the market will remain less than 6.5”, with a growing portion of much larger screens (bigger than 7.2”) arriving with the introduction of foldable phones.
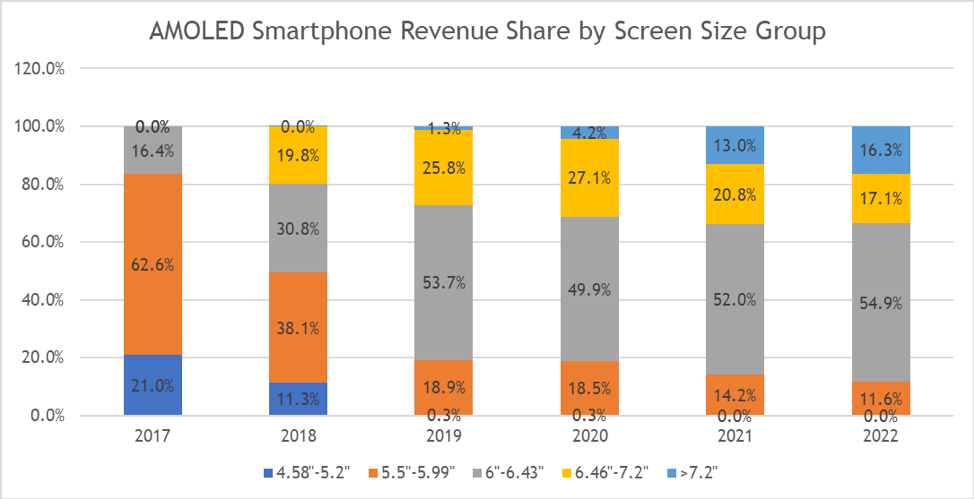
Source: DSCC Quarterly OLED Shipment and Fab Utilization Report
?The growth of the foldable smartphone segment is demonstrated in the next two charts; while foldable panels will represent just over 5% of OLED smartphone panel unit shipments, because of their larger screen size and more importantly higher prices they will represent 16% of OLED panel revenues in 2022 with $5.5 billion in sales.
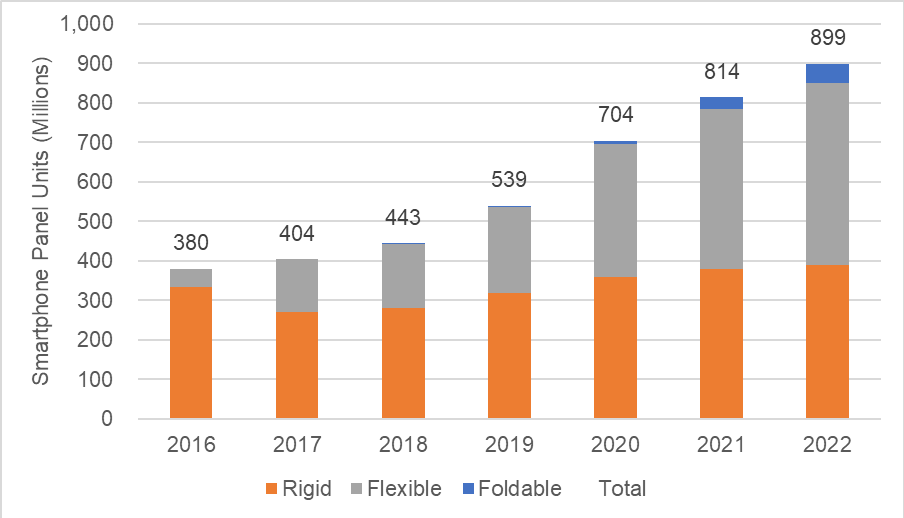
Source: DSCC Quarterly OLED Shipment and Fab Utilization Report
Despite the growth of foldable panel revenues, we forecast that revenues from OLED smartphone panels will decline starting in 2022, as the relentless price pressure on OLED rigid and flexible panels, driven by persistent oversupply, outweighs the unit growth.
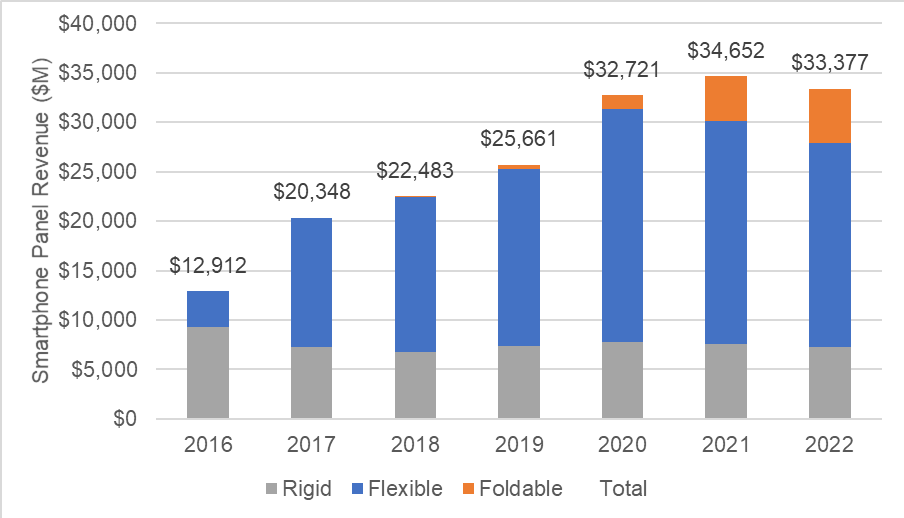
Source: DSCC Quarterly OLED Shipment and Fab Utilization Report?
The report gives a detailed forecast of OLED panel shipments by application, including units, revenues, ASPs, form factors, and other parameters. The next chart on OLED panel revenue by application shows that although smartphone revenue dominates the OLED industry in 2018 with $20.3 billion in revenue or 87% of the total, and smartphone will continue to be the largest application in revenue well into the future, many other applications will grow into sizeable businesses:
- TV panel revenue will exceed $2 billion in 2018 and grow to more than $6 billion by 2022
- Smart Watch revenue will exceed $1 billion in 2018 and grow to $1.4 billion by 2022
- Tablets will be nearly $1 billion in 2020 and grow to $2.4 billion in 2022
- Notebooks and monitors will represent $2.9 billion and $1.4 billion in 2022, respectively
- Automotive panels will approach $1 billion
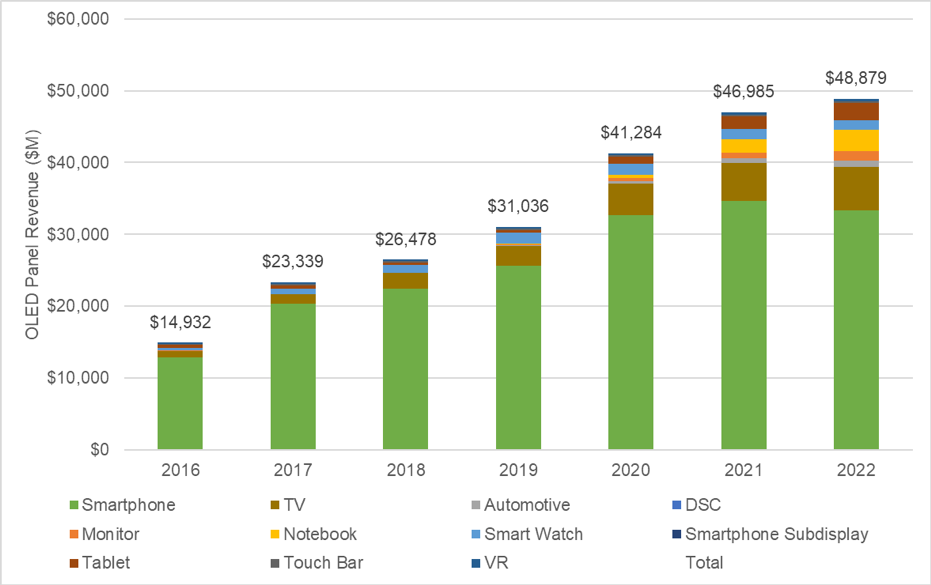
Source: DSCC Quarterly OLED Shipment and Fab Utilization Report
With respect to screen area, smartphone becomes much less important, as shown in the next chart, and TV is expected to surpass smartphone in area terms in 2020. By 2022, TV will represent 53% of total OLED panel area, with smartphone representing 39% and all other applications taking the remaining 8%.
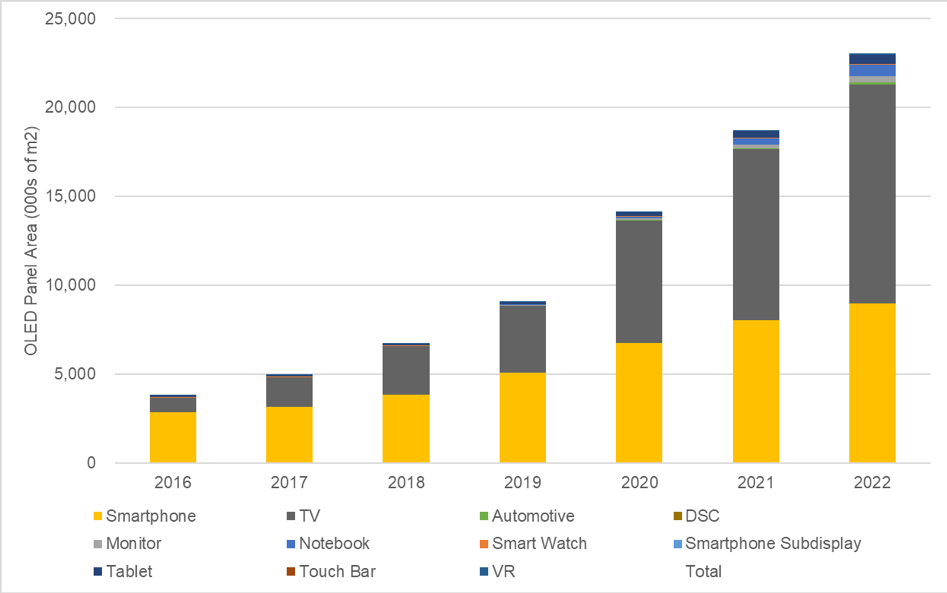
Source: DSCC Quarterly OLED Shipment and Fab Utilization Report
Comparing these two charts, the astute reader will discern that on an area price basis TV panels are substantially lower priced than all other applications; this is true in the current market and will continue to be the case.
- OLED TV panels have an average price of $771 per square meter in 2018, and we expect that this price will decline to $488 per square meter by 2022 (in comparison, LCD TV panel prices in Q4 2018 are in the range of $170-200 per square meter).
- OLED smartphone panels in 2018 have sold at an average area price of $5844 per square meter, and this is expected to decline to $3720 per square meter in 2022, but also consider that in 2022 16% of those OLED smartphone revenues will be foldable panels, which will command a price premium on an area basis.
- Smart Watch panels have an average area price of more than $42,000 per square meter in 2018, and although this will decline, it will continue to exceed $30,000 per square meter in 2022.
- In the OLED industry across all applications, area prices are expected to decline from $3922 per square meter in 2018 to $2119 per square meter in 2022, as the combined effect of price declines in every application and the shift towards TV brings the average price down.
If we consider that even with four more years of price declines, the average area prices for OLED panels will be more than 10x the current prices for LCD TV panels, it’s easy to see why every major panel maker in the industry has been investing in OLED.
?DSCC’s Quarterly OLED Shipment and Fab Utilization Report includes pivot tables for capacity by substrates and area, for UT%, for Revenues, unit shipments, ASPs, area shipments, and many more. The report allows sorting by panel maker, country, Gen size, substrate type, frontplane, brand, application and many more factors. For more information on DSCC’s Quarterly OLED Shipment and Fab Utilization Report or to subscribe, please contact [email protected].