Last week DSCC released the capacity section of its Quarterly Display Capex and Equipment Market Share Report which looks into industry capacity by application, frontplane, backplane, country, supplier, substrate, etc.

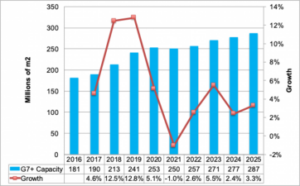
One of the interesting takeaways was the outlook for G7+ capacity for LCDs and OLEDs. As indicated below, G7+ capacity is expected to fall 1% in 2021 after rising by over 12% in 2019 and 2019 and 5% in 2020. This is a result of LCD fab shutdowns in Korea and delays in new fab ramps due to COVID-19. With LCD TV panel demand expected to rebound in 2021, it should keep supply tight, prices should continue to rise, and margins and stock prices should improve for panel suppliers. Will it lead to new spending in LCDs?
We aren’t hearing about that at the moment. Looking beyond 2021, we are optimistically seeing 2% – 6% growth which includes some low probability investments. From 2020-2025 we only see LCD+OLED capacity rising at a 2.5% CAGR which I believe is a historically low figure which could lead to elevated margins for display suppliers for years.
G7+ Display Capacity Outlook

One thing we are hearing about is rising demand for miniLED BLUs for LCDs in a variety of applications. We even see adoption by Korean TV brands in 2021. DSCC will have a miniLED report out in the next 30 days which quantifies miniLED costs by implementation, analyzes technology trends and provides a miniLED shipment forecast by application which will cover not only panels but the LED value as well. For more information, please see our new miniLED report description here.
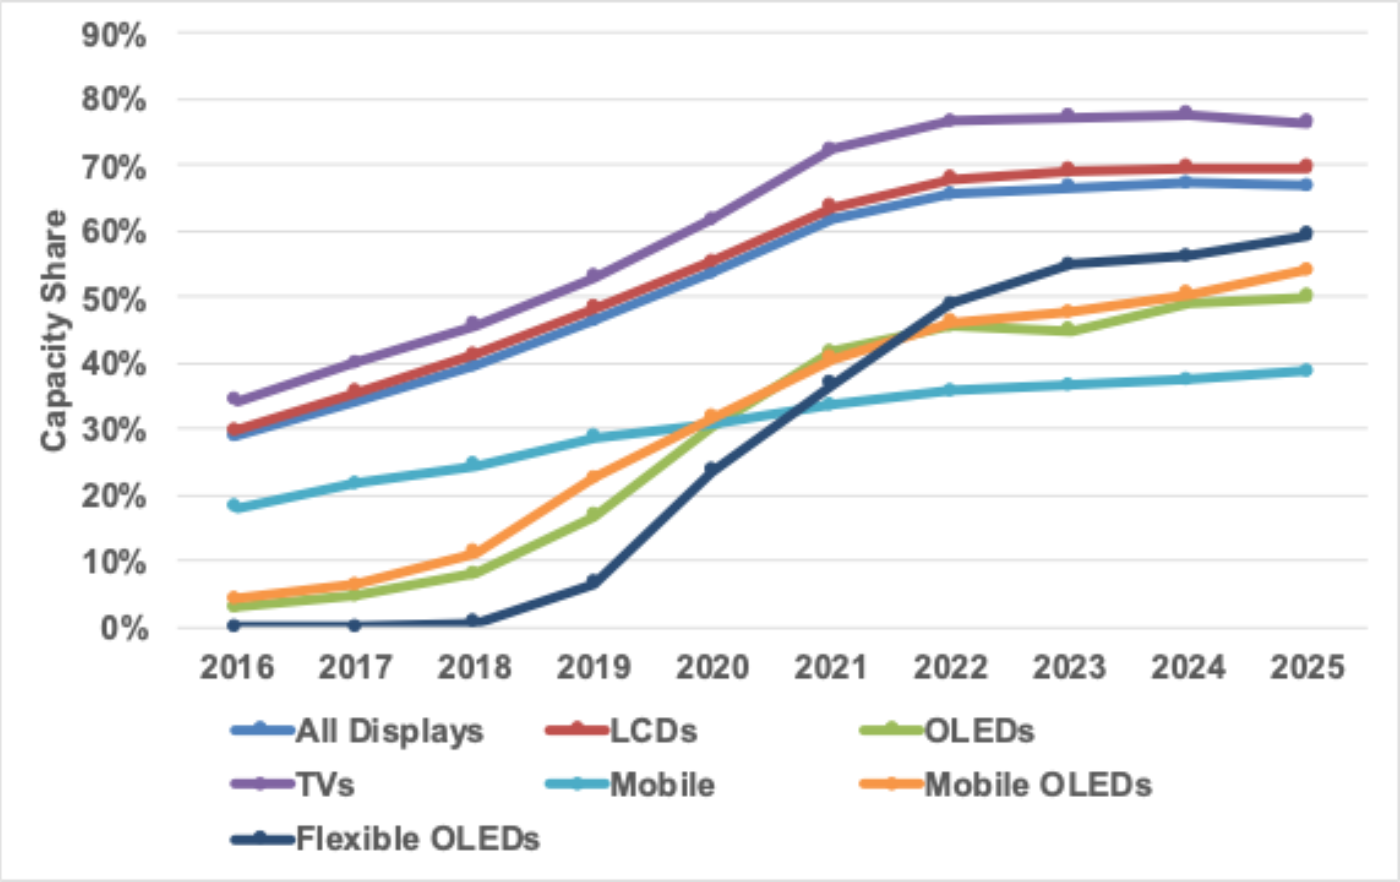
Getting back to our updated capacity outlook, one obvious trend previously touched on is China’s rising share. It is updated here and shown by application. Note, this is based on region of manufacture, so LGD’s OLED fab in Guangzhou is counted as China. As shown, China is gaining unyielded capacity share in all technologies and applications. We see China’s share reaching by 2025:
- 77% in TVs;
- 70% in LCDs;
- 67% in all displays;
- 59% in flexible OLEDs;
- 54% in mobile OLEDs;
- 50% in all OLEDs;
- 39% in mobile displays which includes all display capacity G6 and smaller.
China’s Capacity Share Gains by Technology and Application
By application:
- LCD TVs will continue to dominate total display capacity, but its share will fall from 72% to 67% on a 1.1% CAGR from 2020 to 2025.
- OLED TVs are expected to enjoy the fastest growth rising at a 32% 2020-2025 CAGR with its share rising from 2% to 7%.
- Mobile OLEDs are expected to grow at a 10% CAGR and reach a 7% share, up from 5% in 2020.
- Mobile LCDs are expected to remain flat with a 4% share.
- Other LCDs are expected to fall at a 0.5% CAGR with its share falling from 18% to 15%.
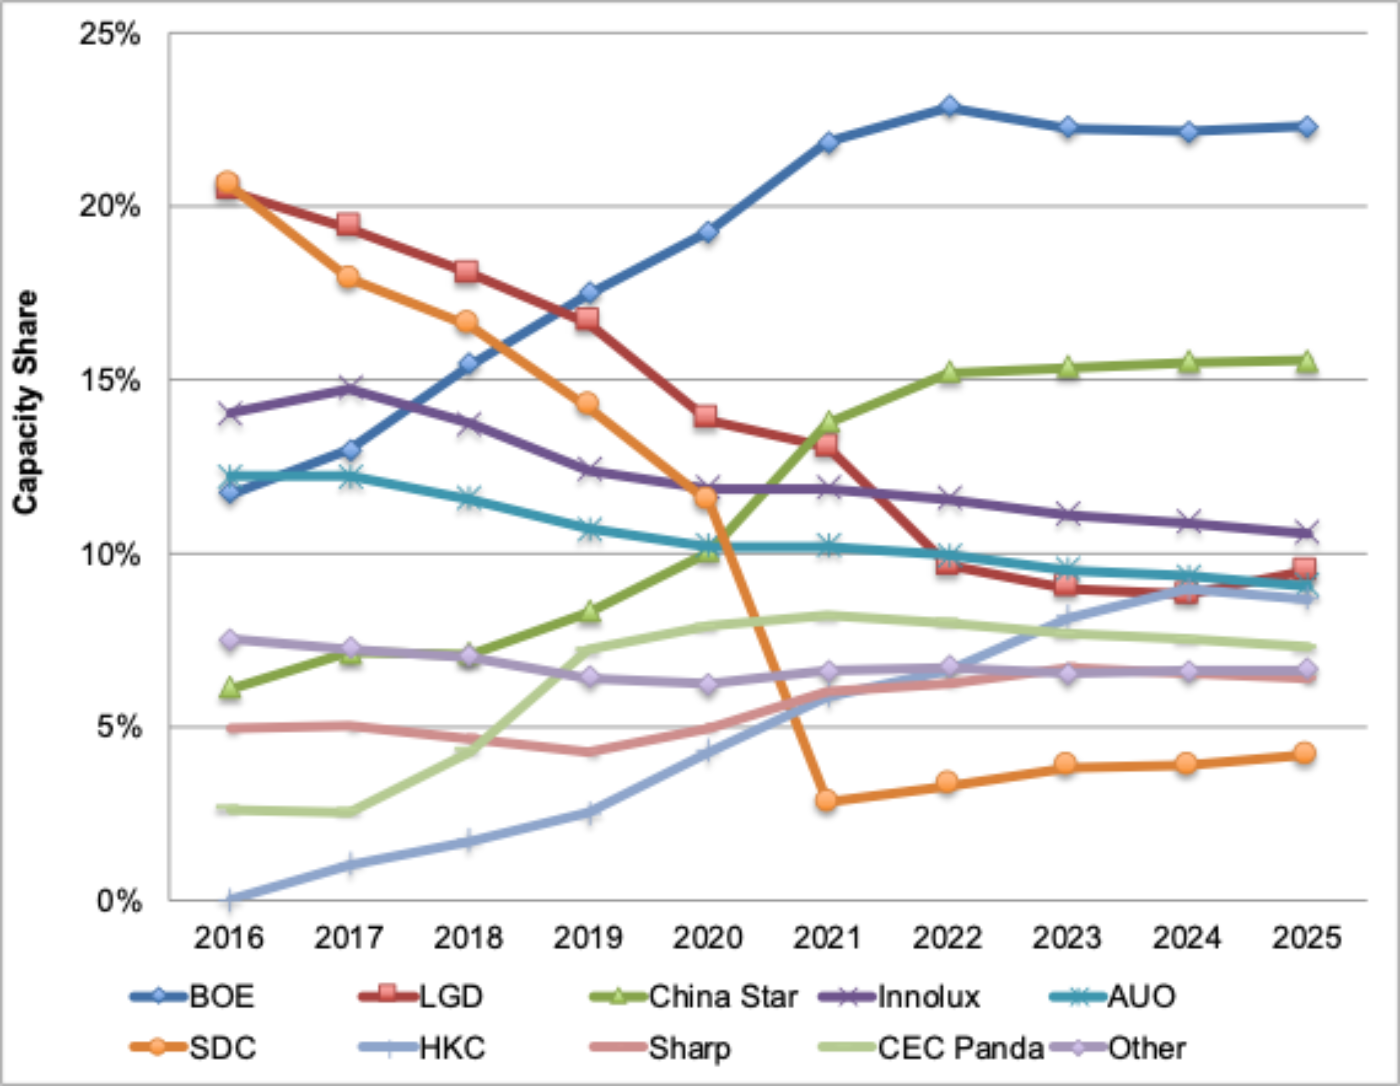
By manufacturer:
- BOE and China Star are expected to dominate total display capacity with more than 1/3 of the market from 2021. China Star’s acquisition of SDC Suzhou is reflected in their share from 2021. CEC Panda’s capacity is still counted as its own entity, although there are reports that BOE may take a majority share by the end of the year or BOE and China Star will each buy one of the G8.5/8.6 fabs owned by CEC.
- In just LCDs, the combined share of BOE and China Star will reach 40% and will rise even higher if a majority share of CEC Panda is acquired.
- In total OLED capacity, SDC and LGD will dominate due to their mobile and TV presence. In mobile OLEDs, SDC will dominate due to their strong rigid and flexible position. In flexible OLEDs, SDC’s advantage will narrow over BOE to less than 2 percentage points by 2025 on an unyielded basis. (RY – [email protected])
Total Display Capacity by Manufacturer
This article was originally published on the DSCC blog and is reproduced with kind permission.