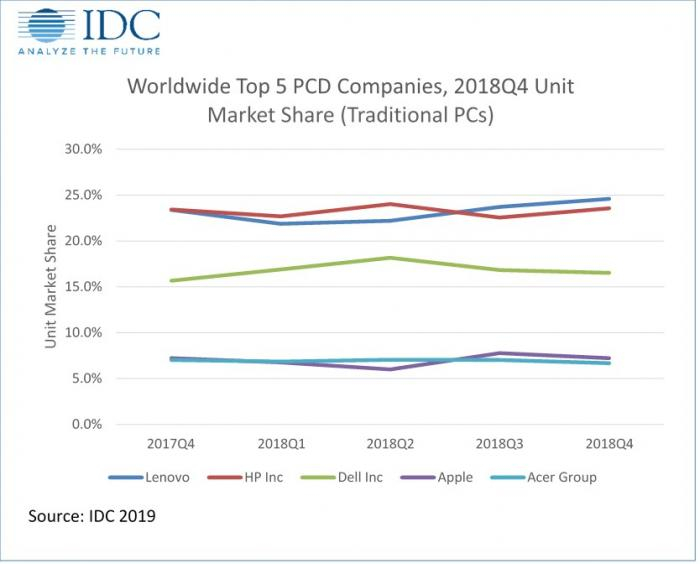
Preliminary results for the fourth quarter of 2018 (4Q18) showed shipments of traditional PCs (desktop, notebook, and workstation) totaled just over 68.1 million units, marking a decline of 3.7% in year-on-year terms, according to the International Data Corporation (IDC) Worldwide Quarterly Personal Computing Device Tracker.
The results slightly outperformed the forecast, which called for a decline of 4.7%, but also produced the largest year-on-year decline since the third quarter of 2016 (3Q16) and capped the full year at a nearly flat rate of -0.4%.
Heading into the quarter there was industry-wide concern over processor shortages and rising economic tensions between the U.S. and China. Aggressive stocking of inventory during the previous quarter (3Q18) in anticipation of the shortage led to some sell-through challenges, driving a reduction of Q4 shipments in some regions. The fourth quarter is typically oriented toward consumer promotions that help drive the industry’s biggest quarter of the year, but the confluence of events in 2018 led to the lowest sequential growth for a holiday quarter since the fourth quarter of 2012.
Nonetheless, the market performed better than expected, with corporate PC refresh – driven by the looming Windows 7 end of life (EOL) in January 2020 – helping to offset consumer market challenges. Japan had an especially strong quarter driven by commercial refresh, which lifted virtually all aspects of the market. All regions except the U.S. exceeded the forecast, although Asia/Pacific (excluding Japan) faced challenges from a difficult Chinese commercial environment.
“The ongoing economic tensions between China and the United States continue to create a lot of uncertainty in the business environment in China. As demand for Chinese products in the U.S. drops, this particularly impacts businesses of all sizes from the manufacturing sector in China, which, in turn, translates to a drop in IT purchases by these companies,” said Maciek Gornicki, research manager with IDC’s Asia/Pacific Client Devices Group. “As a result, the PC market in China is expected to suffer bigger declines throughout the year. And if the trade war escalates further, we should expect spillover of the impact to other countries, particularly due to the expected fluctuations of the exchange rates impacting businesses across the region.”
“As the U.S. PC market, especially the lower-end, continued to suffer from the ongoing shortfall of Intel CPUs, overall PC sales took a hit during the fourth quarter of 2018,” said Neha Mahajan, senior research analyst with IDC’s Devices and Displays Group. “While the processor supply challenges are expected to continue into the first two quarters of 2019, PC makers are likely to see the situation improve before the back-to-school season begins during the latter half of the year.”
Regional Highlights
USA: The traditional PC market in the U.S. saw a modest uptick in volume from the year prior. Total shipments for the quarter reached 16.7 million units, which was slightly below forecast. Commercial shipments remained fairly robust during the quarter, thanks to the ongoing Windows 10 refresh cycle. While market leader HP saw its year-over-year volumes modestly decline (despite a quarter-over-quarter improvement), the other top five vendors mostly saw volumes improve.
Europe, Middle East and Africa (EMEA): The traditional PC market was negative in 4Q18 for the first time in six quarters with both desktop and notebooks reporting a moderate decline. This weakening of the market stemmed from the ongoing component shortages and was further impacted by a level of disruption and uncertainty arising from challenging geopolitical and economic scenarios within major economies in the region.
Asia/Pacific (excluding Japan) (APeJ): The traditional PC market in APeJ posted a single-digit decline in 4Q18, which was relatively close to IDC’s forecast. Overstock in the channels, coupled with Intel CPU shortages, impacted sell-in across the region. In India, a significant drop in consumer demand together with high inventory remaining in the channels led to a stronger than expected decline in the consumer and SMB segments, while Intel supply shortages led to a drop in sales to the enterprise customers. In China, the commercial PC market came in below expectations, impacted by Intel CPU shortages and slowness in spending from the public sector, while U.S.-China trade issues had a negative effect on demand from the private sector.
Japan: Corporate Windows 10 refresh entered its final phase and helped to beat expectations for 4Q18, with growth among virtually all OEMs, although multinational OEMs reaped most of the benefits.
Company Highlights
Lenovo maintained its status as the top OEM in the traditional PC space, and one of only two top 5 companies to post growth in the quarter compared to a year ago. Its US operation continued to recover from a year ago. In APeJ, Lenovo felt increased pressure from HP and Dell, and posted the largest decline within the region among the three vendors.
HP Inc. declined 3.2% worldwide mostly due to a challenging quarter in the Americas. The company fell below market growth in the U.S. where unfavorable comparisons arose due to strong results in 4Q17. At the same time the company weathered the APeJ market slide better than many of its rivals and tied with Lenovo in global market share in the region for all of 2018.
Dell Inc. had the strongest year-on-year growth among the top OEMs at 1.6% for the quarter and ended 2018 growing 5.6% over 2017, also the strongest among the top OEMs.
Apple remained in the fourth position with market share of 7.2% and year-on-year growth of -3.8%. Both desktop and notebook shipments saw year-on-year declines in 4Q18.
Acer Group took fifth place with market share of 6.7% and a year-on-year decline of 8.5%. Acer continues to compete in the gaming space, which remains a big focus for the company in 2019, but challenges within the component constraints likely affected its overall consumer business in 4Q18.
|
Top Companies, Worldwide Traditional PC Shipments, Market Share and Year-Over-Year Growth, Fourth Quarter 2018 (Preliminary results, shipments are in thousands of units) |
|||||
|
Company |
4Q18 Shipments |
4Q18 Market Share |
4Q17 Shipments |
4Q17 Market Share |
4Q18/4Q17 Growth |
|
1. Lenovo* |
16,757 |
24.6% |
16,549 |
23.4% |
1.3% |
|
2. HP |
16,055 |
23.6% |
16,581 |
23.4% |
-3.2% |
|
3. Dell Inc |
11,259 |
16.5% |
11,078 |
15.7% |
1.6% |
|
4. Apple |
4,922 |
7.2% |
5,119 |
7.2% |
-3.8% |
|
5. Acer Group |
4,548 |
6.7% |
4,970 |
7.0% |
-8.5% |
|
Others |
14,594 |
21.4% |
16,425 |
23.2% |
-11.1% |
|
Total |
68,134 |
100.0% |
70,722 |
100.0% |
-3.7% |
|
Lenovo (excluding Fujitsu volume in 4Q17) ** |
16,757 |
24.6% |
15,691 |
22.2% |
6.8% |
|
Source: IDC Quarterly Personal Computing Device Tracker, January 10, 2019 |
|||||
See Table Notes below the second table.

|
Top Companies, Worldwide Traditional PC Shipments, Market Share and Year-Over-Year Growth, Calendar Year 2018 (Preliminary results, shipments are in thousands of units) |
|||||
|
Company |
2018 Shipments |
2018 Market Share |
2017 Shipments |
2017 Market Share |
2018/2017 Growth |
|
1. HP1 |
59,986 |
23.2% |
58,809 |
22.6% |
2.0% |
|
2. Lenovo*1 |
59,857 |
23.2% |
58,049 |
22.4% |
3.1% |
|
3. Dell Inc |
44,170 |
17.1% |
41,822 |
16.1% |
5.6% |
|
4. Apple1 |
18,021 |
7.0% |
19,010 |
7.3% |
-5.2% |
|
5. Acer Group1 |
17,841 |
6.9% |
18,033 |
6.9% |
-1.1% |
|
Others |
58,621 |
22.7% |
63,925 |
24.6% |
-8.3% |
|
Total |
258,497 |
100.0% |
259,647 |
100.0% |
-0.4% |
|
Lenovo (excluding Fujitsu volume in 2017) ** |
59,857 |
23.2% |
54,845 |
21.1% |
9.1% |
|
Source: IDC Quarterly Personal Computing Device Tracker, January 10, 2019 |
|||||
Table Notes:
* Due to the Joint Venture between Lenovo and Fujitsu, which took effect in 2Q18, data for Lenovo in the top line includes Fujitsu volume for both 4Q18 (16.8 million units) and 4Q17 (16.5 million units). The same logic applies to the table for Calendar Year 2018.
** For year-on-year comparison, an extra line has been added below the table to show what Lenovo’s growth would have looked like excluding Fujitsu volume through to 1Q18.
1IDC declares a statistical tie in the worldwide personal computing device market when there is a difference of one tenth of one percent (0.1%) or less in the share of revenues or shipments among two or more vendors.
- Some IDC estimates prior to financial earnings reports. Data for all companies are reported for calendar periods.
- Shipments include shipments to distribution channels or end users. OEM sales are counted under the company/brand under which they are sold.
- Traditional PCs include Desktops, Notebooks, and Workstations and do not include Tablets or x86 Servers. Detachable Tablets and Slate Tablets are part of the Personal Computing Device Tracker but are not addressed in this press release.
IDC’s Worldwide Quarterly Personal Computing Device Tracker gathers detailed market data in over 90 countries. The research includes historical and forecast trend analysis among other data.
For more information, or to subscribe to the research, please contact Kathy Nagamine at 650-350-6423 or [email protected].

