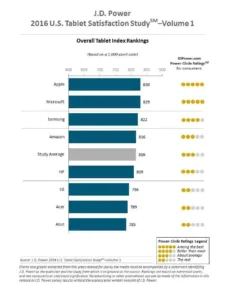
Rising demand for a new breed of hybrid tablets?2 in 1 devices that function as either a laptop or a tablet?is shaking up the tablet market and contributing to a shift in the way owners are interacting with these devices, positively improving the overall user experience, compared with standard tablets, according to the J.D. Power 2016 U.S. Tablet Satisfaction StudySM—Volume 1.
The study, now in its fifth year, measures customer satisfaction with tablets across five factors (in order of importance): performance (28%); ease of operation (22%); features (22%); styling and design (17%); and cost (11%). Satisfaction is calculated on a 1,000-point scale.
2 in 1 Convenience of Hybrid Tablet Boosts Satisfaction
As demand increases for hybrid tablets?those with the capabilities of a touch-screen tablet and laptop computer? so have customer satisfaction and usage activity. This change is the result of a combination of form, function and ease of operation raising the level of convenience found in a 2 in 1 device.
According to the study, satisfaction is 11 points higher for hybrid tablets, compared with non-hybrid devices (827 vs. 816, respectively). Satisfaction in the features factor is significantly higher for hybrids (828) than for non-hybrids (796), with notably high attribute ratings for the variety of input/output connectivity; the amount of internal data storage available; and the variety of preloaded applications available.
Increased Usage Activity, Apps and Data Plans with Hybrids
An increase in usage activity on hybrids is enabled by their ability to function in two core capacities. When using a physical keyboard or a mouse/stylus, customers can use hybrids for work-related activities. When using a touch-screen interface/virtual keyboard, hybrids provide a tablet-like experience for personal use, including sharing content, surfing the Internet and watching movies. Among hybrid tablet owners, usage is higher than among non-hybrid device owners when using Microsoft Office (1.0 hour vs. 0.6 hours for non-hybrids); browsing the Internet (4.5 hours vs. 4.1); using social media (2.4 hours vs. 2.2); and texting/instant messaging (1.1 hours vs. 0.9).
Notably, customers who own hybrid tablets have downloaded more paid apps within the previous 30-day period than those who own non-hybrid tablet devices (2.9 vs. 1.3, respectively). Additionally, owners of hybrid devices have a higher incidence of data plans (33% vs. 28% among non-hybrid owners).
“Increasing the number of activities that can be done on a single device has a positive impact on the overall user experience,” said Kirk Parsons, senior director and technology, media & telecom practice leader at J.D. Power. “Hybrid tablets are raising customer expectations for device performance. Brands with a strong lineup of hybrids are in a favorable position to satisfy the needs of consumers interested in a single device for business computing and entertainment. A satisfying hybrid tablet experience can lead to brand loyalty, recommendations and repurchase intent.”
Study Rankings
- Apple (830) ranks highest in overall satisfaction; performance is higher than the segment average in all factors except with cost.
- Microsoft (829) ranks second performing well in the features and styling & design factors, followed by Samsung (822) performing well in the styling & design factor.
Following are some of the key findings of the 2016 study:
- Tablet Device Satisfaction Is Up: Overall customer satisfaction with tablet devices is 816, up slightly by 2 points from the 2015 U.S. Tablet Satisfaction Study—Volume 2 released 6 months ago.
- Premium Price Paid for Hybrids: The average customer-reported price paid for a hybrid tablet is $444, compared with$277 for a non-hybrid tablet.
- High-Performing Tablet Brands Have High Repurchase Rates: Among customers whose previous tablet was an Apple, 80% purchased another Apple for their current tablet. The second-highest repurchase rate is for Samsung tablets (57%).
The 2016 U.S. Tablet Satisfaction Study—Volume 1 is based on experiences evaluated by 3,485 tablet owners who have owned their current device for less than one year. The study was fielded between September 2015 and February 2016.

