More than 29 million PC monitors were shipped worldwide in Q1’15, according to IDC. The figure represents a 12% fall YoY, and was 1.5% below the firm’s forecast.
There were some bright spots – shipments in Japan, for instance, rose 2% after four consecutive quarters of declines. However, IDC is still predicting the trend of declining shipments to continue in the near term. There “may be” some improvement later in the forecast, with new product campaigns targeting the consumer segment, as well as contributions from the SMB and SOHO categories, said IDC’s Phuong Hang.
In Q2, IDC is predicting a 3.4% YoY fall in monitor shipments, to 28.8 million units. Around 120 million monitors are expected to be shipped this year – falling to less than 104 million in 2019.
LED backlighting remained the dominant screen technology – now with a 98.5% market share. Likewise, 21.5″ remained the world’s most popular screen size – as it has been for the last 10 quarters. 21.5″ monitors’ share rose 23.8% in Q1.
IDC expects shipments of monitors with TV tuners to grow 10.4% YoY, to a 6.4% market share next year. This year, a 5.4% share is predicted. LG and Samsung will lead this category, with a combined share of 96.4%.
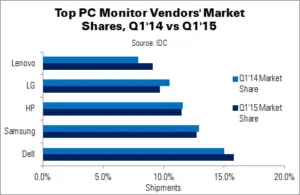
Dell was the world’s largest monitor vendor, with a global share of 15.8% (4.6 million units). The vendor enjoyed growth in Canada and the MEA region. Samsung came in second, maintaining its position despite a YoY fall of 13.3% (to 3.7 million units). However, Samsung still managed to grow shipments in Canada and Western Europe.
HP grew shipments in the CEE and LATAM regions, finishing Q1 with an 11.5% market share (3.4 million units). However, growth in these areas was not enough to offset the overall decline of 13% YoY.
LG rose to fourth place, shipping almost 2.9 million units. Shipments rose in Canada. Lenovo, with a 9.1% share, rounded out the top five. The company recorded ‘huge’ gains in CEE, LATAM, MEA and Western Europe.
| Worldwide PC Monitor Shipments, Market Share and Growth – Q1’15 | |||||
|---|---|---|---|---|---|
| Vendor | Q1’15 Units | Q1’14 Units | Q1’15 Market Share | Q1’14 Market Share | YoY Change |
| Dell | 4,641,513 | 5,032,525 | 15.8% | 15.0% | -7.8% |
| Samsung | 3,731,542 | 4,305,138 | 12.7% | 12.9% | -13.3% |
| HP | 3,377,347 | 3,881,946 | 11.5% | 11.6% | -13.0% |
| LG | 2,864,010 | 3,502,178 | 9.7% | 10.5% | -18.2% |
| Lenovo | 2,683,486 | 2,636,358 | 9.1% | 7.9% | 1.8% |
| Others | 12,158,607 | 14,096,500 | 41.3% | 42.1% | -13.8% |
| Total | 29,456,505 | 33,454,645 | 100.0% | 100.0% | -12.0% |
| Source: IDC | |||||