The perennial problem with supply-demand forecasts is that demand is a function of price. Watching internal and external analysts forecast supply-demand up close and personal for 20 years leads me to conclude that such forecasts are misleading at best and dangerous at worst. There is an alternative.

Consider supply. While LCD makers have the option to increase or decrease asset utilization over the short term, they must average a high loading rate over the long term in order to sustain themselves financially. Even if their balance sheet assets decline into maturity (or competitive capitulation) display makers cannot turn fabs on or off easily. We saw how hard that was during the 2009 downturn. Thus, supply can be forecast independent of sentiment. One can see cranes and cement trucks at a fab construction site, or not. Forecasting fabs is like forecasting elephants…they make the ground shake even if you can’t see them coming.
In contrast, forecasting demand requires several assumptions, some of which are seldom made explicit by the supply-demand forecaster. The forecaster must assume some allocation of capacity by market segment, then by product category. That was difficult before one-drop fill processes were adopted widely 10 to 15 years ago. It is more difficult today because producers use Gen-8 capacity to serve multiple markets and to make panel sizes ranging from 4”to 80”. Once some heroic assumption is made about capacity allocation generally, the demand forecaster must assume some specific pricing by product category. That initiates a mental loop, even if unconscious, because pricing assumptions affect allocation. More important, no one expects the Spanish Inquisition. Looking at published forecast data over several decades, I note a consistent degree of error in expected prices, which were twice as high three years out as the display area price we saw three years later. The pace of area price decline has slowed since 2009 but it remains an exponential function, which most people in the business find too disconcerting to accept, despite the data. As a result, demand rises to meet supply because price adjusts to preserve historical dynamics rather than some executive’s ego.
That demand is a function of price should not be too hard to follow. Imagine a box car full of iPhone 6’s getting derailed near Lake Wobegon. If some enterprising local wanted to sell this stock before the insurance adjuster arrives, the retail price would be discounted to clear the supply quickly. Conditions are similar when several panel makers bring new fabs on-line. We used to see dramatic price declines in the order of -40% YoY while the industry was doubling capacity in two years or sooner and next-gen fabs were ramping up in waves from 1998–2008. Today, only Chinese entrants are growing capacity 40% a year while most producers are allocating capacity based on price-profit opportunities. Such arbitrage makes it difficult to forecast demand as producers shift glass inputs from mobile to automotive on a monthly basis. Even if we ignore price effects, creating surpluses or shortages in particular product categories as we see today in the great rotation from tablets to TVs can disrupt business plans from producer to retailer.
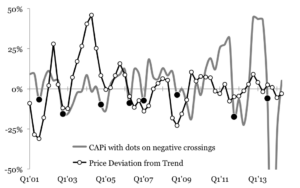
Once the relationship between supply and price becomes clear, it becomes possible to predict crystal cycle turning points based on capacity acceleration alone. Assumptions about demand and beliefs about prices are not needed or wanted. As explained in the Crystal Cycle chapter of the Handbook of Visual Display Technology (Springer), inverting the polarity of supply acceleration (its growth of growth) provides an indication of price boom to bust turning points. I used this capacity acceleration price indicator (CAPi) several times while forming LG Display and taking it public, so I know it has created value for companies and investors using it.
The concept of supply-price has held up quite well and I look forward to updating everyone during the SID Display Week 2015 Business Track. – David Barnes
The url for the Springer handbook is: http://www.springer.com/us/book/9783540795667

