DSCC released its latest Quarterly OLED Supply/Demand and Capital Spending Report last week which included significant upgrades to OLED markets.
OLED Revenue Forecast
Revenues and Demand
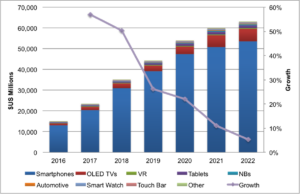
- DSCC now sees OLED revenues rising 57% in 2017 to $23.2B as shown in Figure 1. 2018 growth is also expected to be strong, up 50% to $34.9B. Double-digit growth is expected to continue through 2021 resulting in 27% CAGR from 2016 to 2022 to $62.8B.
- DSCC has upgraded OLED TV panel shipments from 2018 in response to strong demand as OLED TVs take more share in the high end of the TV market. LG is stretching its existing capacity, adding more capacity and shifting its product mix to meet demand. OLED TV panel revenues are expected to grow at a 37% CAGR to $5.9B in 2022 with units rising at a 49% CAGR to 9.5M panels in 2022.
- Smartphones are expected to maintain a dominant share of the OLED market with at least 85% share over the forecast with revenues rising at a 27% CAGR to $54B in 2022.
- OLED smartphone panel shipments are expected to rise at a 24% CAGR to 1.37M panels with curved panels overtaking rigid panels in 2019. Foldable display shipments are also expected to begin in 2019 and are forecasted through 2022 in this report. OLEDs are expected to overtake LCDs in the smartphone market in 2020 with full penetration expected in 2027.
- OLED panel shipments for all applications are expected to rise at a 25% CAGR from 394M in 2016 to 1.48B in 2022.
- Smart Watches and Tablet PCs are expected to be the #2 and #3 applications on a unit basis depending on the year.
- LCD smartphones are projected to fall at an 11% CAGR from 1.22B units in 2016 to 614M in 2022.
# of Fab Investments and OLED Equipment Spending
- This report identifies 86 different phases of OLED capacity investments from 2016 – 2022 with 10 new phases added this quarter. Mobile OLED capacity has been upgraded from 2019 as a number of new investments were pulled into 2018, most notably Samsung’s A5 fab.
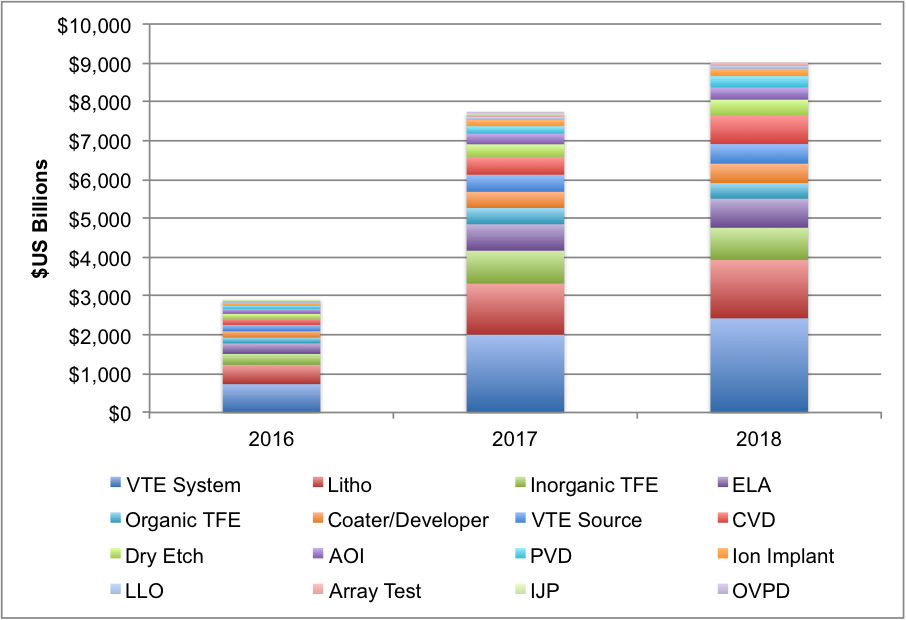
- 8 additional equipment segments were added to the report this quarter with the entire list now including
- VTE Systems
- VTE Source
- Ink Jet Printing
- Organic Vapor Phase Deposition (OVPD)
- Inorganic Thin Film Encapsulation (TFE)
- Organic TFE
- Laser Lift Off (LLO)
- Automated Optical Inspection (AOI)
- Lithography
- Coater/Developers
- Excimer Laser Annealing (ELA)
- Array Test
- Physical Vapor Deposition (PVD)
- Chemical Vapor Deposition (CVD)
- Dry Etch
- Ion Implant
- Market share and design wins are provided for all the OLED front plane segments and for ELA and ion implant fab-by-fab and quarter-by-quarter.
- For all the segments covered, OLED fab equipment spending is expected to rise 166% in 2017 to $7.7B and 17% in 2018 to $9.0B as shown in Figure 2. VTE systems, litho, inorganic TFE, ELA and CVD are expected to be the top 5 segments over the forecast.
- A number of equipment segments are dominated by a single supplier. In FMM VTE, inorganic TFE, organic TFE, LLO, AOI, ELA and ion implant, the top supplier is expected to have at least a 58% share in 2017.
- From 2016 – 2022, Korea and China are expected to spend nearly the same amount of money with Korea holding a slight 48.4% to 48.0% advantage.
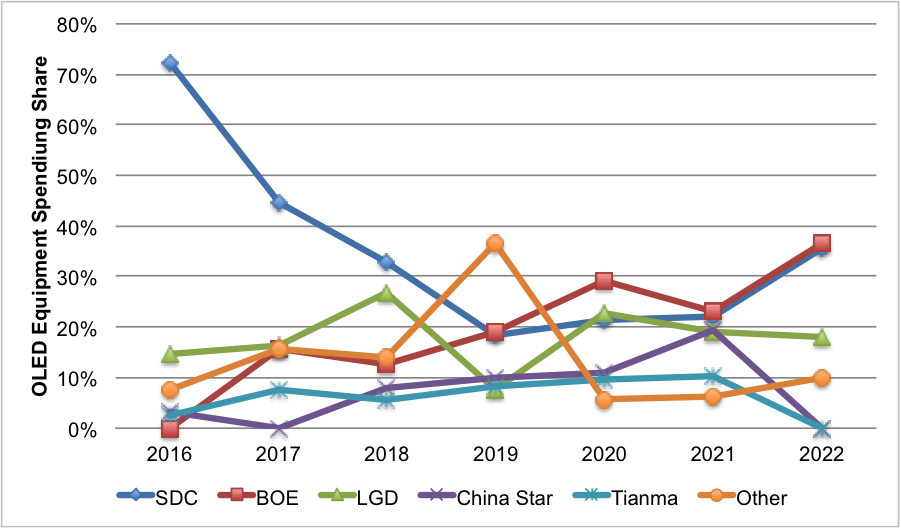
- Samsung is expected to lead in equipment spending annually through 2018 with BOE leading from 2019-2022 with a slight advantage over Samsung as shown in Figure 3. From 2016 – 2022, Samsung is expected to lead with a 33% to 19% share advantage over BOE and LG.
OLED Fab Equipment Spending
Capacity Growth
- Realistic OLED input capacity for mobile applications is expected to rise at a 36% CAGR from 5.3M m2 in 2016 to 33.7M m2 in 2022.
- Apple is expected to account for 38% of mobile input capacity in 2018, from 0% in 2016, before declining to 22% of capacity by 2022 as others grow
- Most of the mobile capacity investments will be for flexible substrates. As a result, flexible mobile OLED capacity will overtake rigid capacity in Q4’17 on an input basis and Q3’18 on an output basis.
- Korea is expected to account for the highest share of capacity for mobile applications through the forecast, but falling from 94% in 2016 to 63% in 2022.
- China’s OLED capacity for mobile applications is expected to rise at a 114% CAGR with its share rising from 4% in 2016 to 36% in 2022.
- OLED TV capacity is expected to rise at a 38% CAGR on an input basis from 2.0M m2 in 2016 to 13.5M m2 in 2022
OLED Fab Equipment Spending by Panel Manufacturer
Supply/Demand
- With OLED capacity tight in 2017 and Apple and Samsung expected to consume much of the OLED supply growth in 2017 and 2018 as they transition to almost 100% OLED smartphones, the OLED supply/demand situation is not expected to loosen until 2019.
- There is a modest opportunity for an OLED smartphone display surplus in 2018 at the 11% level, based on the huge investments made in 2016-2017. In 2019, the surplus is expected to be 16% with the ability of more smartphone makers to get panels and allowing for prices to ease.