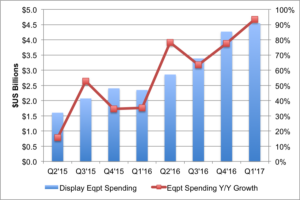
Display Supply Chain Consultants (DSCC) has begun tracking and forecasting the overall display equipment market as part of its recently launched Quarterly Display Capex and Equipment Service.
As shown in Figure 1, the Q1’17 display equipment market rose 6% Q/Q and 93% Y/Y to $4.5B, following the capex trend which was up 8% Q/Q and 106% Y/Y to $8.9B. According to DSCC CEO Ross Young, “The display equipment market is enjoying unprecedented growth as a result of two major investment cycles occurring simultaneously. The first cycle is derived from OLEDs completely replacing LCDs in the smartphone market. This cycle is expected to last until the middle of the next decade given the size of the smartphone market and the capital intensity of flexible OLED fabs, which cost 2-5X more than similar LCD fabs. OLEDs are being sought after in the smartphone market not only for improved display quality, reduced weight and thickness, but also for new flexible, foldable and rollable form factors, which will result in unbreakable and larger displays, which will drive higher revenues and margins for smartphone brands as well as OLED panel suppliers. The second cycle is a result of tight supply for 60” and larger 4K TVs, which is resulting in at least five 10.5 generation fabs in the next few years, which will help reduce the cost and prices for these products. These are also expensive fabs which are helping to drive the display equipment market to new heights.”
As shown in Figure 2, Canon was the leading equipment supplier in Q1’17 with a 16% share on over 500% Y/Y growth as it now enjoys over a 50% share in the two largest equipment segments – lithography and evaporation. Canon sold more exposure tools than Nikon for the first time since Q3’14 in Q1’17 and its Tokki subsidiary has a dominant position in the OLED evaporation market. AMAT was #2 on strength in CVD and inorganic PECVD encapsulation for flexible OLEDs. SFA Engineering was #3 on significant shipments of automation and various tools to Samsung. In total, ten companies experienced greater than 50% growth with 6 companies up over 90%. In general, equipment companies strong in flexible OLED specific equipment should enjoy the fastest growth as those markets outperform. These companies include Toray Engineering for polyimide coating, Tera Semicon and Viatron for polyimide curing, AP Systems for laser lift off, AMAT, Jusung and Kateeva for thin film encapsulation, etc.
Because more Korean and Chinese equipment companies are gaining share, the Other category is growing faster than the market as a whole. Also, automation is growing quickly due to the significant number of additional process steps associated with flexible OLEDs. As a result, more automation, Korean and Chinese companies will be added to our company specific coverage. Equipment supplier financials are also analyzed and aggregated and have reached new highs as shown in Figure 3 with operating margins reaching 13% and net margins climbing to 10%.
Looking forward, Young believes that strong quarterly growth in equipment spending should continue throughout 2017. In addition, with LG and Samsung pulling in some OLED business from 2019 into 2018, there should be display equipment revenue growth in 2018 as well.
DSCC’s Display Capex and Equipment Service also examines industry capacity in detail through the distribution of comprehensive pivot tables on fab schedules and industry capacity by company, technology, region, substrate size, etc. As indicated in Figure 4, OLED input capacity is expected to rise at a 40% CAGR to 41M square meters with flexible OLED input capacity rising at an 82% CAGR to 23M m2 and a 56% share of OLED capacity. Flexible OLED input capacity is expected to overtake LTPS LCD input capacity by 2019. In terms of OLED capacity, Samsung is way out in front, but with LG focused on TVs which consumes more glass area, LG may potentially catch Samsung in total OLED area capacity in 2021 depending on the exact timing of its 10.5G OLED fab. However, in the case of flexible OLED capacity, Samsung is not expected to be caught anytime soon and will still have over a 40% share in 2021 as shown in Figure 5 with BOE emerging as a clear #3 after LG Display in 2019.
In terms of total display capacity, LCD capacity is expected to rise at a 6.6% CAGR assuming no more shutdowns and still enjoy a 90% share by 2021, down from 97%. By region in total display capacity as shown in Figure 6, China is expected to lead from 2017 and reach nearly half of total display capacity in 2021. In terms of supplier capacity share for both LCD and OLED, BOE is expected to lead from 2019 as shown in Figure 7 with a relatively narrow advantage over LG Display. However, if we look at just LCD capacity as shown in Figure 8, BOE’s advantage will widen to 5 percentage points in 2021.
The report also examines capacity by fab generation. As indicated in Figure 9, 8.5G is expected to dominate for some time. However, 10.5G is expected to grow rapidly and quickly overtake 6G in 2021 with a 15% share. 6G should stabilize at 15% from 2017 – 2021. <5G will fall to 2% and we should more of these fabs shut down.
This new service also carries out “What If” analyses such as how many 6G smartphone fabs are necessary to fully saturate the smartphone market with OLEDs and how many 10.5G fabs are necessary to meet 60”+ demand. It also provides equipment supplier design wins, market share and analyzes and aggregates equipment supplier and panel supplier financials.

