DSCC released the forecast slides for the Q1’18 issue of its Quarterly OLED Shipment and Fab Utilization Report last week.
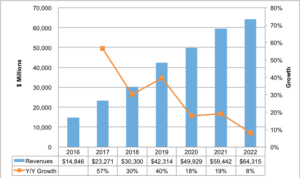
Given the lower than expected iPhone X shipments, reduced fab utilization at Samsung and related fab delays, we have lowered our outlook for 2018 by 22% and now expect 30% growth to $30.3B as shown in Figure 1. From 2017 to 2022, we now expect 23% CAGR instead of 27% CAGR with the 2022 market reaching $64.3B instead of $79.6B. It is still a rapidly growing market as most consumers prefer OLEDs and OLED capacity is still growing rapidly. It is just growing slower than previously expected.
Figure 1: Latest OLED Revenue and Growth Forecast
Source: DSCC’s Quarterly OLED Shipment and Fab Utilization Report
Smartphones are expected to remain the dominant market, accounting for around 91% of units per year with the smartphone revenue share falling from an 87% share in 2018 to a 79% share in 2022. On an area basis, smartphones are expected to fall from a 64% share in 2017 to a 50% share in 2022 as shown in Figure 2, with TVs rising from 33% to 42% and tablets the #3 application with a 3.5% share.
Our latest OLED smartphone panel forecast shows 543M units in 2018 vs our prior forecast of 622M units, a 13% reduction, but still up 34% Y/Y. In particular, flexible OLED smartphones were adjusted downward by 22% for 2018 to 238M units, but still up 70% Y/Y. Rigid OLED smartphones were reduced by 4% vs. last quarter for 2018, but are still projected to rise 12% Y/Y. Blended OLED smartphone ASPs were also adjusted downward, due to lower prices stemming from lower fab utilization and lower flexible OLED penetration. We now see OLED smartphone ASPs at $49 for 2018 vs. our prior forecast of $56 with flexible OLED smartphone ASPs at $83 instead of $90, a 7% reduction, and rigid OLED ASPs at $22 instead of $23, an 8% reduction.
Figure 2: OLED Area Share by Application
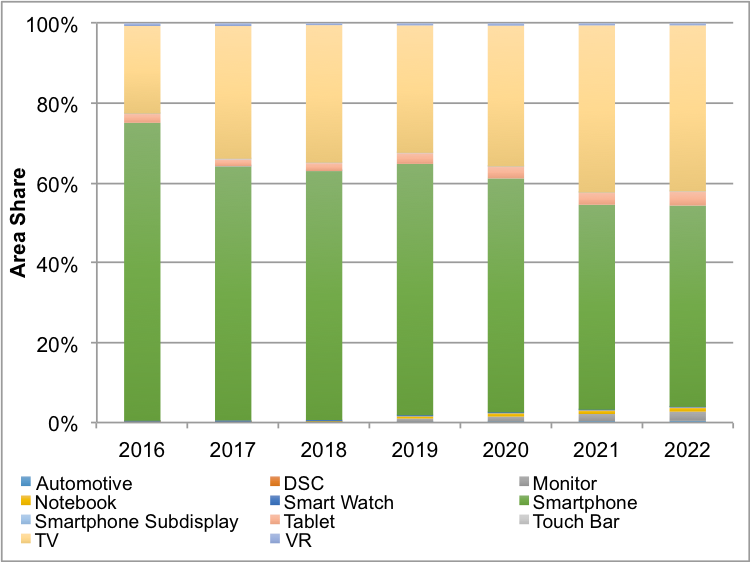
Source: DSCC’s Quarterly OLED Shipment and Fab Utilization Report
OLED smartphones are now forecasted to grow at a 23% CAGR vs. a 24% CAGR in last quarter’s report, reaching 1.12B units instead of 1.27B units. OLEDs are expected to overtake LCDs in smartphones in 2021 as shown in Figure 3 and reach a 57% unit share of the total smartphone market. We expect small volumes of foldable OLED smartphone panels in 2018 and expect them to grow to 108M units in 2022, approximately 10% of the OLED smartphone market and 5% of the total smartphone market. LCD smartphone panels are expected to fall at a 7% CAGR from 1.2B in 2017 to 843M in 2022 as capacity falls in this segment on lack of profitability and inability to match foldable OLEDs.
On a revenue basis for all applications by 2022 as shown in Figure 5, we expect foldable OLEDs, with their significantly higher prices, to account for 24% of the OLED market with flexible at 50% and rigid at 26%. There is no question that a high percentage of the new capacity is going towards flexible and foldable which will push down prices and drive their growth. Flexible/foldable revenues are expected to grow at a 28% CAGR vs. rigid at an 11% CAGR and total OLED revenues at a 23% CAGR.
With more expensive flexible and foldable OLEDs gaining share along with larger sizes, we expect blended OLED ASPs to be relatively flat throughout the forecast at around $52. The average OLED size is expected to rise by 21% from 5.4” in 2017 to 6.6” in 2022 and OLED area output is expected is expected to rise at a 35% CAGR to 13.1M square meters.
Other highlights of this report include the addition of more model level tracking for smartphones. This report now shows quarterly shipments for over 20 different OLED smartphone models with more added as they come to market.
For more information on this report, please contact [email protected] or (832) 451-4909.
Figure 3: OLED vs. LCD Smartphone Panel Unit Share
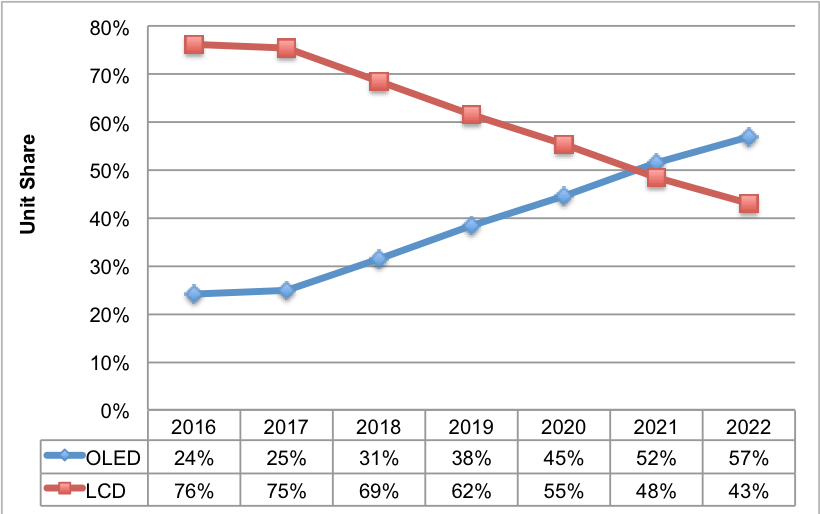
Source: DSCC’s Quarterly OLED Shipment and Fab Utilization Report
Figure 4: Smartphone Panel Shipments by Type
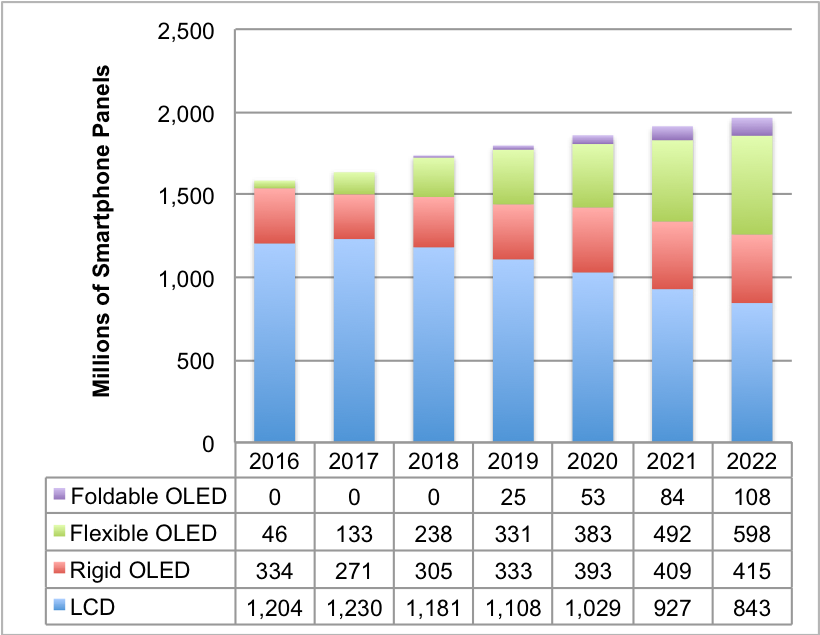
Source: DSCC’s Quarterly OLED Shipment and Fab Utilization Report
Figure 5: OLED Revenue Share by Form Factor
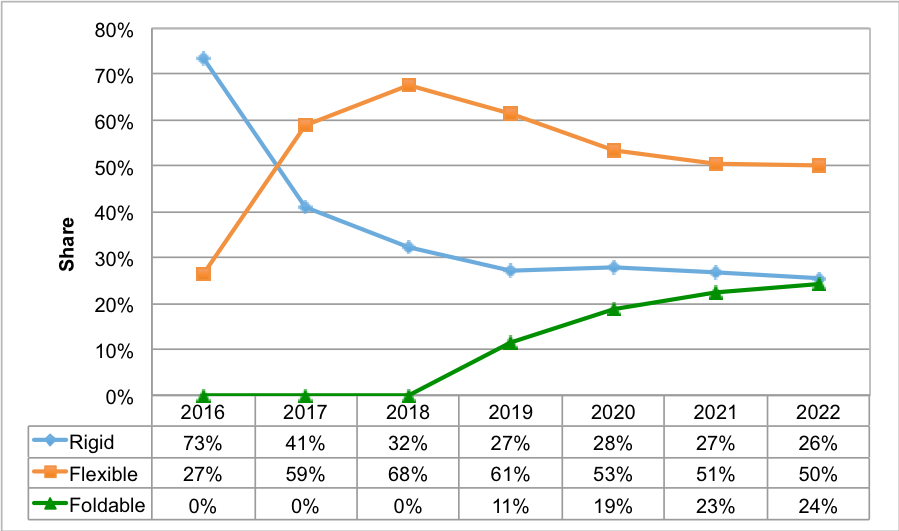
Source: DSCC’s Quarterly OLED Shipment and Fab Utilization Report