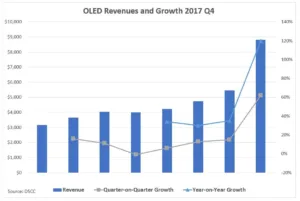
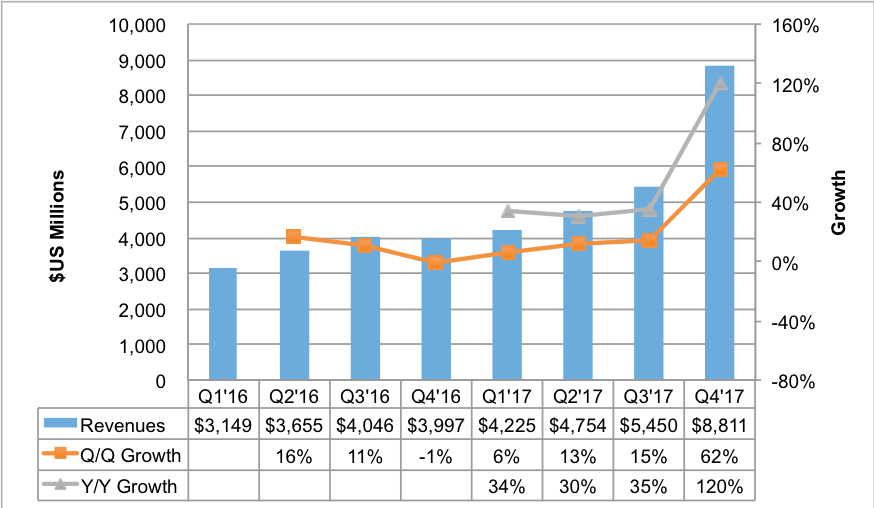
Display Supply Chain Consultants has published OLED shipment, revenue and market share results for the fourth quarter of 2017. As expected, OLEDs enjoyed a record quarter, with a significant jump in panel shipments for the iPhone X and OLED TVs during the holiday season. OLED panel revenues rose 62% quarter-on-quarter and 120% year-on-year in the fourth quarter of 2017 to a record $8.8 billion. For the entire year, OLED revenues grow 57% to $23.2 billion.
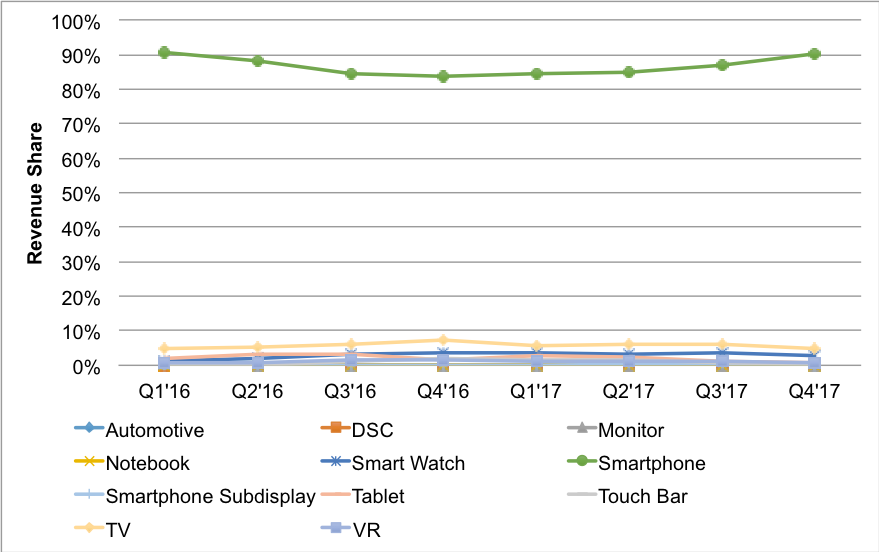
In terms of applications, smartphones gained share in the fourth quarter of 2017, reaching 90.2% of the market, at $7.95 billion. For the year, smartphones accounted for $20.3 billion, or 87.4%, up from 86.7% in 2016. OLED TV panel revenues rose 35% quarter-on-quarter and 51% year-on-year to $438 million and a 5% share, down from 6% in the previous quarter. For the year, OLED TV panels were the second-largest OLED application in terms of revenue, with a 5.6% share and $1.3 billion in revenue, up 49% year-on-year. Smartwatch panels were the third-largest application in 2017, with a 3.2% share. No other application accounted for more than a 2% share due to the dominance of smartphones. On an area basis, things were much closer, with smartphones leading with a 64% to 33% advantage over TVs for 2017.
 Source: DSCC
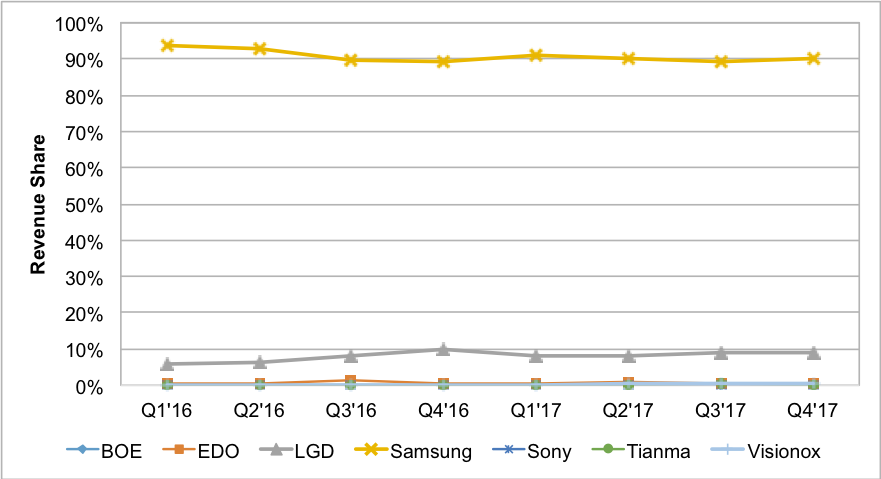
Looking at suppliers, Samsung earned a 90.1% share in the fourth quarter of 2017, with $7.9 billion in revenue, up 63% quarter-on-quarter and 222% year-on-year. It was followed by LG Display at 8.8% in the fourth quarter and 8.6% for the year. Although six other suppliers earned OLED revenues, no other supplier had more than a 0.5% share, either during the quarter or the year. Despite their low share, Chinese OLED suppliers did enjoy strong growth, up 98% to $278 million, and are expected to jump 177% in 2018 to $771 million. In terms of units, China’s OLED shipments rose 124% to 11.7 million, and are expected to rise 143% in 2018 to 28.4 million.
 Source: DSCC
The report also tracks shipments and share by customer. Samsung was the leading OLED brand in 2017, with a 47% share and over $10 billion in OLED panel procurement. Apple was second with a 29% share. In the fourth quarter, Apple led with a 52% share, with Samsung at 30% due to the iPhone X. LG was the number three brand with a 5% share. Apple is expected to lead in 2018 as well, followed by Samsung and LG.
 Source: DSCC
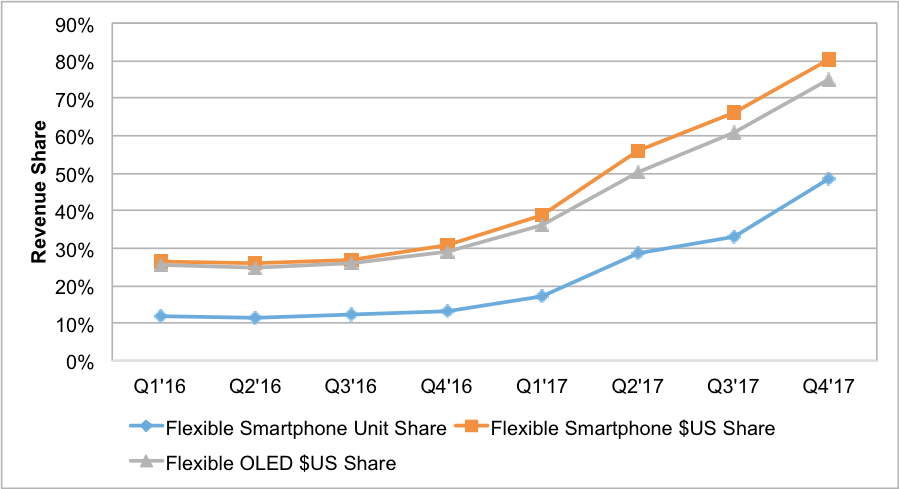
DSCC reports OLED form-factor, covering rigid versus flexible, and soon, foldable and rollable. On a revenue basis, flexible OLED beat rigid OLED across all applications for the third consecutive quarter, reaching a 75% share in the fourth quarter, with growth of 100% quarter-on-quarter growth to $6.6 billion. For 2017, flexible revenues outpaced rigid revenues with a 59% to 41% share advantage and a year-on-year growth of 251%, with rigid revenues down 14%. In smartphones only, flexible OLEDs reached a 48% unit share in the fourth quarter, up from 33%, helped by the iPhone X. On a revenue basis, the higher-priced flexible OLED had an 80% share in the fourth quarter, up from 66%, with 104% growth to $6.4 billion.
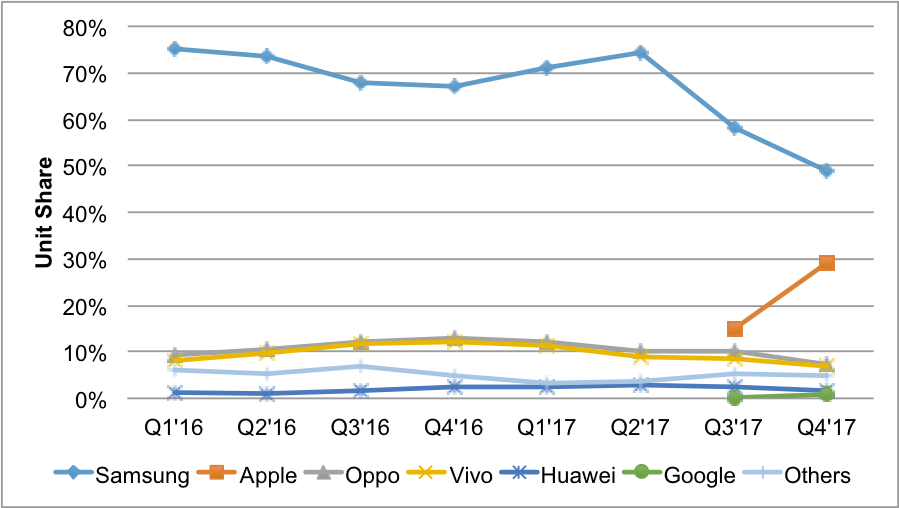
In terms of the OLED smartphone market, shipments rose 31% quarter-on-quarter and 24% year-on-year to 123 million, a record high, with rigid shipments at 63 million and flexible shipments at 60 million. 5” was the leading rigid size while 5.8” was the leading flexible size, and the leading size overall, driven by iPhone X shipments. Samsung was the leading customer on a unit basis, with a 49% share, followed by Apple at 29%, and Oppo and Vivo at 7% shares respectively. Samsung was also the leading panel supplier in the fourth quarter of 2017, with a 96% unit share, followed by LG Display with 2%.
While flexible OLED smartphone panel growth was extremely impressive, OLED TV panel growth was also impressive in the fourth quarter. OLED TV panel shipments rose 41% quarter-on-quarter and 106% year-on-year, to 635,000 units, with 55” UHD leading with a 66% share, followed by 65” UHD with a 28% share. In terms of revenue, OLED TV panels rose 35% quarter-on-quarter and 51% year-on-year to $438 million, with 55” UHD holding a 53% share, and 65” UHD holding a 41% share. For the year, 65” UHD held a slight 46% to 45% share advantage over 55” UHD. By customer, LGE was the number-one OLED TV brand at every size and resolution for the year and the quarter, on both a unit and revenue basis. It enjoyed a 72% unit share overall for the year, followed by Sony at 14%.
This report also tracks fab utilisation and does show a significant drop at Samsung Display, due to over-reliance on a single model from a single customer, who is unlikely to lower prices due to significant pricing power. While OLED revenues are currently forecast to drop 29% quarter-on-quarter to $6.3 billion, it will still represent a 48% year-on-year increase. In addition, in the third quarter of 2018, OLEDs are expected to establish a new record high; OLED penetration is set to increase in new smartphones as OLED prices fall.
 Source: DSCC