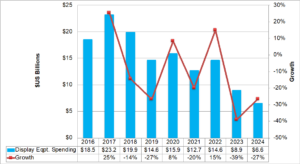
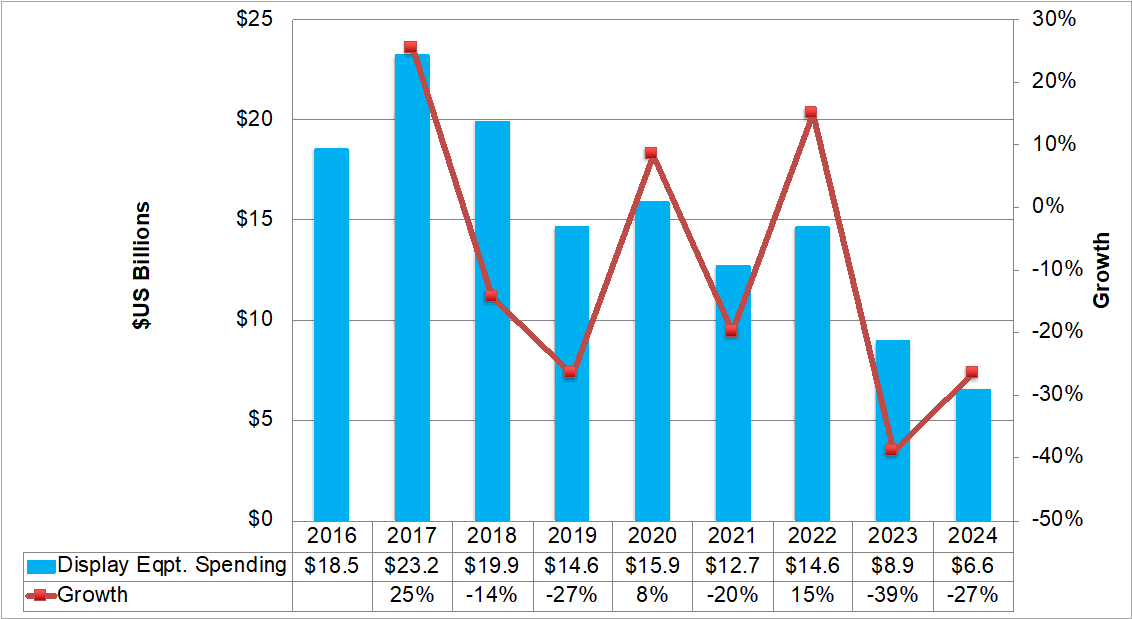
DSCC has increased display equipment spending for the 2018-2024 period by 5% to $93B in its Quarterly Display Capex and Equipment Market Share Report as new fab projects emerge and capital intensity continues to rise.

2019 spending was down 27%, the second straight year of a double-digit decline, with OLED spending down 48% and LCD TV spending flat. In 2020, an 8% increase is expected with OLEDs up 59% and LCDs down 24%. Mobile OLED spending is a bright spot, up 363%.
New projects have been added that boost the 2021 and 2022 outlook such as HKC which has already started issuing awards to equipment suppliers for its H5 fab. Equipment spending on this project is expected to exceed $2.5 billion. In addition, the first RGB Inkjet printed (IJP) OLED mass production fab in China, China Star’s T9 was added and SDC’s A5 mobile OLED and BOE and LGD’s OLED TV capacity were increased over the previous forecast.
DSCC’s Latest Display Equipment Spending Forecast – Source: DSCC’s Quarterly Display Capex and Equipment Market Share Report: Click for higher resolution
Increasing Complexity and Rising Capital Intensity
Increasing complexity and capital intensity are driving our equipment spending forecast higher in mobile OLEDs as market leader Samsung Display looks to maintain its differentiation vs. its competitors, take advantage of its manufacturing prowess by introducing more complicated panels and capture more value per panel, often at the expense of materials suppliers. In mobile displays:
- First, Samsung pioneered the introduction of Y-OCTA, an integrated touch sensor process that adds up to 4 masks to deliver a thinner, more flexible touch sensor. Most flexible OLED manufacturers are adding this process to existing fabs and incorporating it in new fabs.
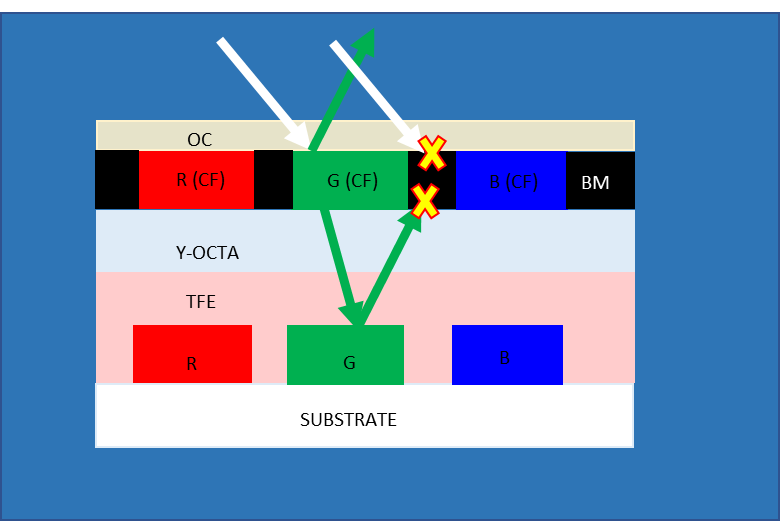 Samsung Display’s COE Structure Source: DSCC’s Quarterly Display Capex and Equipment Market Share Report
Thus, in the case of flexible OLEDs, we are seeing the number of litho tools more than doubling as these processes are adopted.
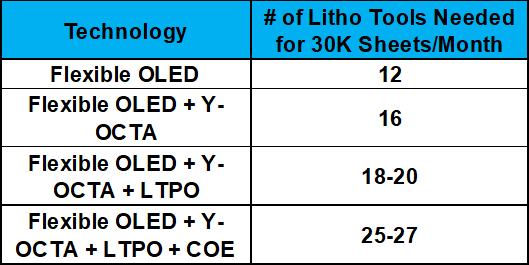 Source: DSCC’s Quarterly Display Capex and Equipment Market Share Report
Similarly, in TVs, we are also seeing rising capital intensity. Examples include:
- Oxide TFT structures used for OLED TVs require around twice as many masks as existing a-Si LCD TV panels;
- WOLED TV panels from LG Display require expensive OLED deposition tools for the bottom emission tandem structure with four emitting OLED layers, but only produce white light. Color filters are still needed to add color as in LCDs resulting in much higher capex.
- QD-OLED structures have an even more challenging frontplane with a top emission microcavity tandem structure with three emitting fluorescent blue layer stacks, thick quantum dot (QD) color converters to convert the blue OLED to red and green and a color filter to minimize blue leakage. It is also expected to require a yellow reflective film to recycle the light emitted in the wrong direction by the QDs, a quarter wave film to minimize ambient light reflection and encapsulation of both the OLED material and the QDs. SDC is also expected to introduce laser drilling at its new QD-OLED fab to connect the main electrode and auxiliary electrode after the OLED deposition.
- Dual cell LCDs require a second TFT backplane, equaling oxide TFTs. They also require four glass substrates, three polarizers and two LC layers.
- LCD TVs with miniLEDs can require an LTPS backplane for the miniLED backlight.
Equipment Spending Forecast by Technology/Application/Country/Supplier and More
Getting back to the equipment forecast, by frontplane type, OLEDs account for a 72% share from 2019-2024 or $53 billion with LCDs at $21 billion and a 28% share. OLEDs are expected to lead annually from 2020. LCD investment is now forecast to end in 2022 after some investments were pulled in which were pushed out last quarter on the deterioration of market conditions. They were pulled in when LGD and SDC discontinued their LCD production faster than previously expected which has led to rising prices and improving market conditions. Looking at non-mobile OLED spending from 2019-2024, we show WOLED leading with a 52% share followed by QD-OLED with a 30% share and RGB IJP with an 18% share.
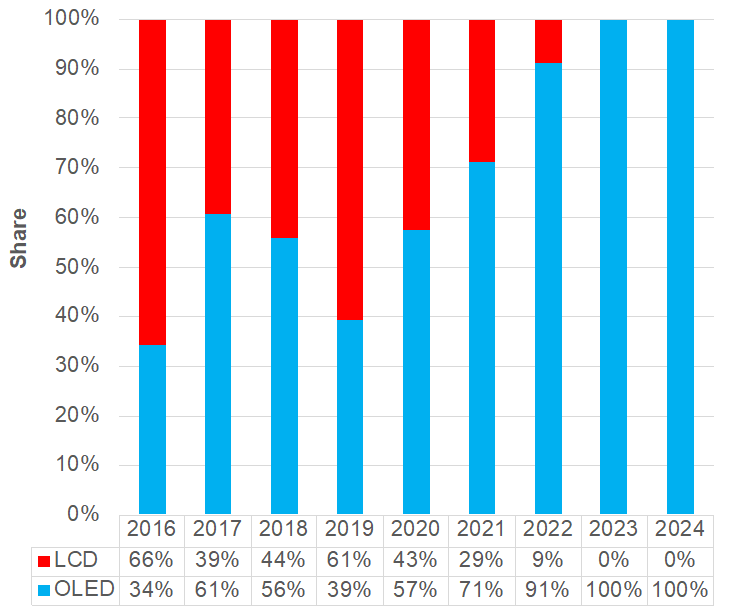 OLED vs. LCD Spending Share Source: DSCC’s Quarterly Display Capex and Equipment Market Share Report
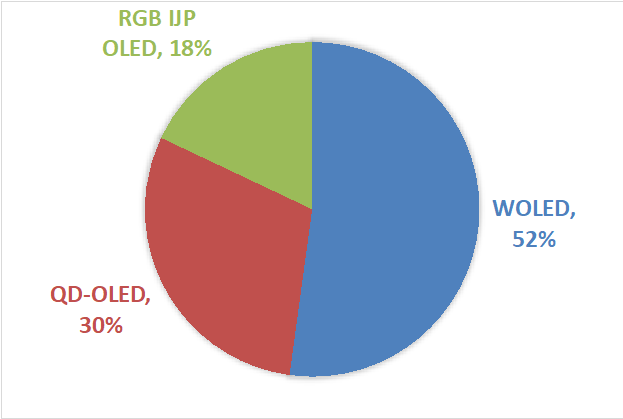 OLED TV Equipment Spending by Technology: 2019-2024 Source: DSCC’s Quarterly Display Capex and Equipment Market Share Report
Looking at spending by application, while the mobile share fell to just 11% in 2019, it is expected to enjoy at least a 40% share annually through 2024 with over $7 billion in spending annually from 2020-2022. TV spending is expected to decline in 2020 and 2021 before rebounding in 2022 as OLED TV spending is expected to pick up. Looking at OLED spending by application, TVs should lead in 2019 and 2023 with mobile OLEDs accounting for a 63% share of the 2019-2024 spend helped by rising capital intensity.
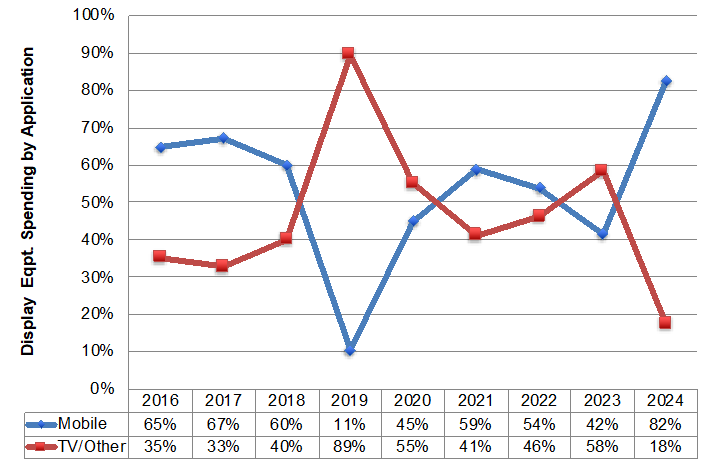 Equipment spending by application – Source: DSCC’s Quarterly Display Capex and Equipment Market Share Report
In part 2, I’ll look at investments by region and by equipment vendor. (RY)
?Ross Young is the founder and CEO of Display Supply Chain Consultants (DSCC), a leading display market research, consulting and events firm which he started in 2016. Ross has a long history in the display industry. Prior to DSCC, Ross was SVP of Displays, LEDs, Lighting and PV at IMS Research after the firm acquired his market research business Young Market Research (YMR). Prior to YMR, Ross was VP of New Market Creation at Samsung LCD where he reported to the CEO. From 1996 – 2008, Young started, ran and sold DisplaySearch which became the leading source of market intelligence, events and consulting to the flat panel display supply chain.