JD Power said that its 2016 Streaming Video Satisfaction Study showed that the those with the highest customer satisfaction were ‘cord stackers’, that is to say, customers who subscribe to a traditional cable/satellite service in addition to streaming video service.
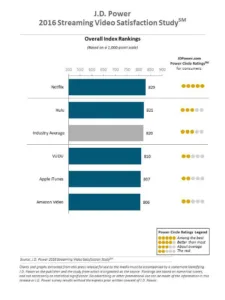
The study measures customer satisfaction by examining six key measures (listed in order of importance): performance and reliability; content; cost of service; ease of use; communication; and customer service. Scores for each measure are reflected in an index based on a 1,000-point scale.
Although the number of customers who cut the cord on pay TV is growing, the majority of streaming video customers still purchase a paid TV service in addition to a streaming video service. Three-fifths (60%) of streaming customers are cord stackers; 23% are cord shavers (those who still subscribe to TV but have downgraded their service package); 13% are cord cutters (those who have recently canceled TV service); and 4% are cord nevers (those who have never subscribed to pay TV and only subscribe to streaming video service).
Following are some of the study’s key findings:
- Binge-Watching High: Nearly two-thirds (62%) of customers use a streaming service to binge watch—the act of watching multiple episodes in succession—TV programming. Overall satisfaction is 35 points higher among those who binge watch vs. those who do not (834 vs. 799, respectively). As binge-watching sessions increase in duration, so does overall satisfaction: 823 among those whose most recent session lasted less than four hours; 841 among those whose session lasted 4-8 hours; and 858 among those whose session lasted 8 or more hours.
“The streaming video customer experience appears to be stratifying across the different subscriber segments, with pay TV service still having a major effect on the overall streaming video experience,” said Kirk Parsons, senior director and technology, media & telecom practice leader at J.D. Power. “Part of the reason is demographics. Customers who only stream are younger than those who also have TV. Nearly two-fifths (37%) of customers who only stream are 18-34 years old, compared with 30% of those who also have TV. Notably, 52% of cord nevers are 18-34. Also, streaming-only customers are less likely to use transaction-based streaming services, which perform higher in the content measure.”