Warranty Week has examined Apple’s warranty business. As well as being one of the world’s largest product warranty providers, the company also runs one of the world’s largest extended warranty plans – largely due to the iPhone.
In 2003, 72% of Apple’s overall revenues came from the Mac computer line, and a small amount from the iPod. The iPhone made an appearance in 2007, and the iPad in 2010.
BY 2012, the iPhone represented half of Apple’s revenues, and the iPad another 21%. In the company’s most recent fiscal year, which ended on the 26th September, the iPhone generated almost 65% of revenues – while Macs had plunged to 11%. Apple’s music business now mainly generates revenues from digital music sales to end users. The other major service in Apple’s product line is the sale of AppleCare and AppleCare+ extended warranties
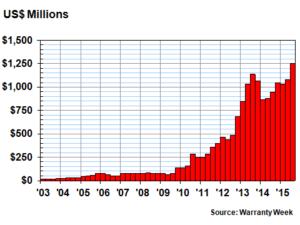
Since the late 2000s, Apple’s warranty claims paid have spiked. $4.4 billion was paid in the most recent fiscal year, up from almost $3.8 billion in fiscal 2014. This is more than either GM or Ford paid over the same time period.
Apple’s Product Warranties Claims Paid per Quarter ($ Millions)Accruals – effectively, the amount put aside to cover future warranty expenses – is the other major product warranty metric. It is based entirely on expectations and closely linked to sales.
There were two recent spikes in Apple’s accruals, in Q4’13 and Q4’14 – the first fiscal quarters of Apple’s financial year. Claims expenses, however, were lower than Apple’s expectations in both cases.
Accruals in fiscal 2015 were slightly up from 2014, but down from 2013. However, the annual total was close to $5 billion in all three years: a figure than only GM and VW have ever passed.
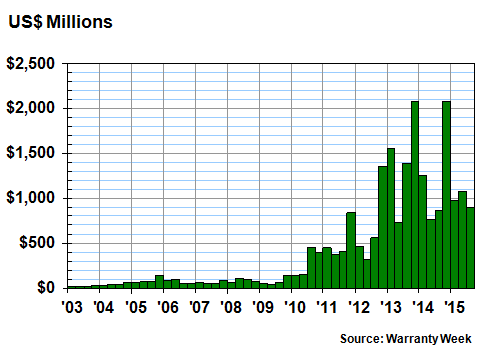 Apple’s Product Warranties Accruals Paid per Quarter ($ Millions)Huge sales figures are the reason for these high expenses – specifically, sales of comparatively easy-to-damage products, like the iPhone. iPhone sales surpassed $155 billion last year, and even the Mac line enjoyed its best year ever ($25.5 billion).
A different trend emerges when comparing warranty expenses to product revenues, then when it is matched to accruals. This is a way to calculate the percentage of product revenue that goes towards warranty expenses. Expenses were somewhat high between 2004 and 2006, lower between 2007 and 2012 and have been a little high since then.
Over the past 12 years, product warranty costs have ranged from 1% to 4%; costs this year were somewhere in the middle, with a claims rate of 2.1% and accruals of 2.3%. This, says Warranty Week, is good news, as Apple seems to have successfully managed the migration of its product line from desktops to smartphones, without encountering the troubles experienced by Palm or Blackberry.
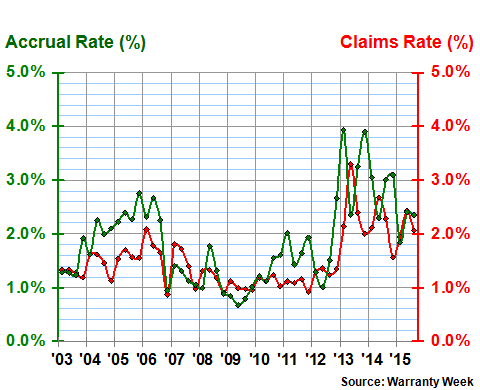 Claims Paid and Accruals Made as a Percentage of Product Revenue
Extended Warranty Estimates
Extended warranties are those sold to people separately, as an option for the customer to increase the protection they are eligible for. Apple does not disclose a sales total for its AppleCare/AppleCare+ extended warranties, but does share a ‘deferred revenue’ total – the amount of money it generates from sales of gift cards and extended warranties. Again, however, the total is not split between these two sources.
Warranty Week performs a very rough ‘guesstimate’ to tell how the revenue is split. Some deferred revenue is current (it will be recognised in one year or less) and some is non-current (won’t be recognised for a year or more). Most AppleCare contracts run for two years. At any given point, WW assumes that half of AppleCare revenue is current and half is non-current. Therefore, the remainder must be from gift cards (which are always classified as current).
Using this approach, WW estimates that AppleCare warranties are now worth $7.3 billion worldwide. Even if this is off by up to $1 billion, it still makes Apple one of the world’s largest extended warranty providers. The amount is still growing about 20% YoY.
Another assumption that must be made is that claims are being paid on the AppleCare warranties, and that the amount of deferred revenue is similar to the amount of accruals made for regular warranties. This means that accruals can be compared to AppleCare sales. Using this very rough estimate, it can be seen that the split between extended warranty revenues and accruals ranged from 80%/20% in 2003, to almost 50%/50% in 2013 – the only year in which AppleCare revenue actually declined, which the accrual rate was climbing.
The current ratio is 41% product warranty to 59% extended warranty; the long-term average is about 33% to 67% (1:2). In other words, extended warranties are bringing in around twice as much money as is going back out as accruals.
Comparing product accruals/claims to AppleCare, WW shows that AppleCare has always (aside from two spikes in 2013) been a bigger (generating more revenue) programme than Apple’s product warranty operation.
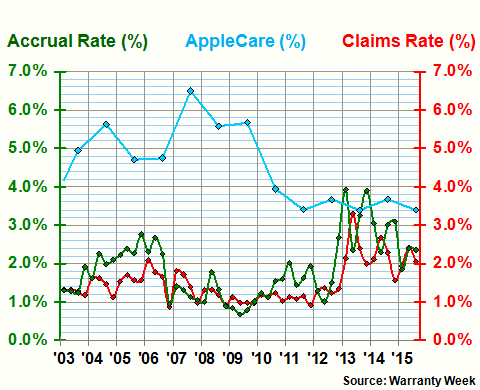 Claims, Accruals and AppleCare Sales as a Percentage of Product Revenue
AppleCare for iPhones in the USA
Warranty Week estimated the amount of AppleCare revenue from US/non-US and iPhone/non-iPhone operations in 2013. It has now added 2014 and 2015 data to its calculations. It is estimated that the US iPhone protection programme is worth around $2.2 billion – although other retailers, combined, still generate slightly more. It is estimated that Apple will take the lead next year, partly due to Best Buy beginning to sell AppleCare warranties along with iPhones.
Finally, WW has produced an estimate of protection plans for all other consumer goods in the USA. Compared to mobile phones and passenger cars, these products are losing market share simply by standing still, with a value of around $10 or $11 billion. Some segments are growing, others are not, but none are rising as quickly as mobile phones (34%, or $40.6 billion) and passenger cars (41%).
In 2009, cars were 38% and phones were 20%, with ‘everything else’ leading the market with a 42% share. The ‘problem’ is that many products are more durable or less expensive than they used to be, so consumers feel less need to protect them.
So, WW concludes, it is a good thing that Apple shifted its product mix. Even if everyone in the world owned a smartphone, there would still be a healthy replacement market – and even if this falls off, there will still be a protection market.